Advanced Statistics for Doctoral Research
Advanced Inferential Frameworks
Beyond Significance
In foundational statistics, Null Hypothesis Significance Testing (NHST) is presented as the final arbiter of an effect. A p-value below 0.05 is celebrated, and one above is lamented. For doctoral research, this binary thinking is insufficient. A statistically significant result simply suggests that an observed effect is unlikely to be due to random chance. It tells you nothing about the magnitude or practical importance of that effect.
A study with a massive sample size might find a statistically significant effect that is, in reality, trivially small and meaningless. Conversely, a pilot study with a small sample might show a large, potentially important effect that fails to reach statistical significance. Relying solely on the p-value forces you to overlook this crucial context.
The goal of your methodology is not just to show an effect exists, but to quantify its size and be confident in your ability to detect it.
This is where effect size and statistical power come into play. They are the essential companions to any p-value, providing a more complete picture of your findings. Effect size measures the strength of a relationship or the magnitude of a difference, while power analysis determines the probability that your study will detect an effect of a certain size.
Effect Size
noun
A quantitative measure of the magnitude of a phenomenon. It is a standardized value that allows for the comparison of results across different studies.
Common effect size metrics include Cohen's d for comparing two means, and eta-squared () for ANOVA, which represents the proportion of variance in the dependent variable explained by the independent variable. For instance, Cohen's d expresses the difference between two means in terms of their pooled standard deviation.
Power and Precision
Before you collect a single piece of data, you should conduct a power analysis. This procedure helps you determine the minimum sample size required to detect an effect of a specific size at a desired level of significance. It's a critical step in justifying your research design and resource allocation in a dissertation proposal.
Power is the probability of correctly rejecting a false null hypothesis. In simpler terms, it's the probability of not making a Type II error (a false negative). This is intrinsically linked to the risk of a Type I and Type II error trade-off. While we often fix the probability of a Type I error () at 0.05, the probability of a Type II error () is influenced by sample size, effect size, and . Statistical power is calculated as .
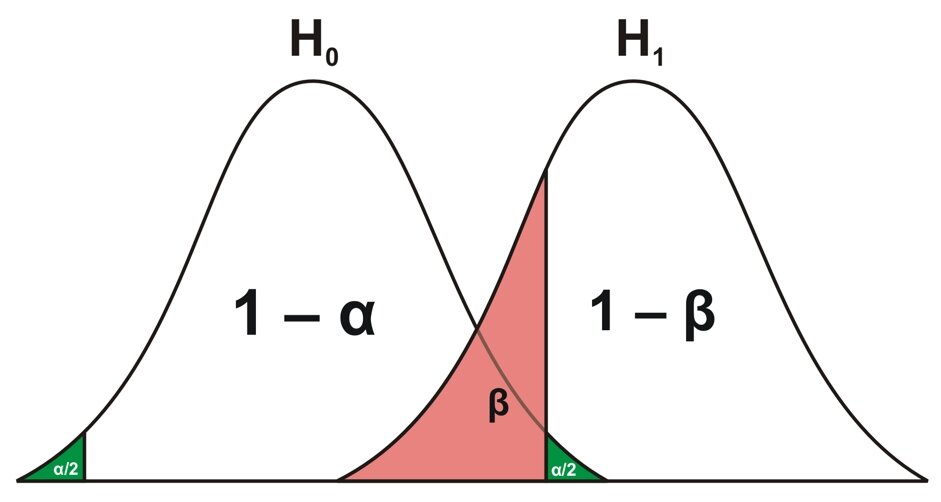
A study with low power is a waste of time and resources. If the power is only 40%, you have a 60% chance of missing a real effect, leading you to wrongly conclude that your intervention or theory has no merit. Most fields aim for a power of at least 80% ($1 - 0.20$). Conducting an a priori power analysis is now a standard requirement for funding agencies and dissertation committees.
Two Philosophies of Inference
The methods discussed so far fall under the umbrella of frequentist statistics. This is likely the framework you were first taught. It defines probability as the long-run frequency of an event over many repeated trials. The parameters of a population (like the true mean) are seen as fixed, unknown constants, and our statistical procedures provide probabilities about the data, given those parameters.
An alternative and increasingly popular framework is Bayesian inferences. It takes a different philosophical stance, defining probability as a degree of belief in a proposition. In the Bayesian view, it is perfectly legitimate to talk about the probability of a parameter itself. A Bayesian analysis combines prior knowledge about a parameter with the evidence from observed data to produce an updated, or posterior, probability distribution for that parameter.
| Feature | Frequentist Inference | Bayesian Inference |
|---|---|---|
| Probability | Long-run frequency of an event | Degree of belief or confidence |
| Parameters | Fixed, unknown constants | Random variables with distributions |
| Prior Info | Not formally incorporated | Formally incorporated via a prior distribution |
| Main Output | p-values & confidence intervals | Posterior probability distributions |
The choice between these frameworks is not merely academic; it has practical consequences for your dissertation. A frequentist approach is often computationally simpler and is the historical standard in many fields. It is well-suited for controlled experiments where you want to make a definitive reject/fail-to-reject decision.
A Bayesian approach, however, is exceptionally useful when you have existing knowledge from prior studies or expert opinion. It allows you to formally model this uncertainty and update your beliefs as new data comes in. It also provides a direct probabilistic statement about your hypothesis (e.g., "there is a 95% probability that the effect lies between X and Y"), which is often what researchers intuitively, but incorrectly, think a frequentist confidence interval tells them.
Your choice of inferential framework should be a deliberate decision, justified by your research question, the nature of your data, and the conventions of your field.
A research study with a very large sample size reports a statistically significant result (p < 0.001) but a very small effect size. How should this finding be interpreted?
What is the primary purpose of conducting an a priori power analysis?
Ultimately, a sophisticated dissertation methodology moves beyond simply reporting p-values. It involves a thoughtful engagement with the size of effects, the power of the study design, and a conscious choice of the statistical philosophy that best aligns with the research goals.