Advanced Statistics for Data Science Mastery
Multivariate Analysis
Handling Many Variables at Once
In the real world, data is rarely simple. We're often faced with datasets that have dozens, or even thousands, of interconnected variables. Trying to understand them one by one is like trying to understand a city by looking at a single street. Multivariate analysis gives us the tools to see the bigger picture, revealing the patterns and relationships that emerge when we look at all the variables together.
These techniques are about finding the signal in the noise when the noise comes from many directions at once.
Simplifying Complexity with PCA
Imagine trying to describe a person's physical fitness. You could measure their mile run time, max bench press, vertical jump, body fat percentage, resting heart rate, and so on. You'd end up with a long list of numbers for every single person.
Principal Component Analysis (PCA) is a technique that helps us condense all that information. It finds a new set of variables, called principal components, that are combinations of the original ones. The first principal component (PC1) is crafted to capture the largest possible amount of variation in the data. The second component (PC2) captures the next largest amount of variation, and so on.
Often, the first two or three components can summarize most of the important information from the original, much larger set of variables. Instead of juggling ten fitness metrics, we might be able to use just two or three summary 'fitness scores' that tell us almost everything we need to know. This process is called dimensionality reduction.
This isn't just for convenience. Reducing dimensions helps machine learning models run faster and can sometimes improve their performance by focusing on the most important patterns. It's widely used in fields like genetics to analyze gene expression data and in facial recognition to distill key facial features.
Uncovering Hidden Structures
Sometimes, the variables we can measure are just symptoms of a deeper, unobservable cause. For instance, in a survey, you might ask people if they enjoy parties, feel comfortable in large groups, and like meeting new people. These are all distinct questions, but they're likely influenced by an underlying personality trait: extraversion. This hidden trait is called a latent variable.
Latent Variable
noun
A variable that is not directly observed but is rather inferred from other variables that are observed and directly measured.
Factor Analysis is the tool we use to identify these latent variables, or 'factors'. It examines the correlations between our observed variables and groups them based on the underlying factors they seem to represent. This is incredibly useful in psychology for building personality models and in market research for understanding what truly drives consumer behavior.
Discriminant Analysis is used for a different purpose: classification. It helps us figure out which variables are most powerful in distinguishing between two or more predefined groups. For example, a bank could use discriminant analysis on loan application data to find the key financial metrics that separate applicants who are likely to default from those who are not.
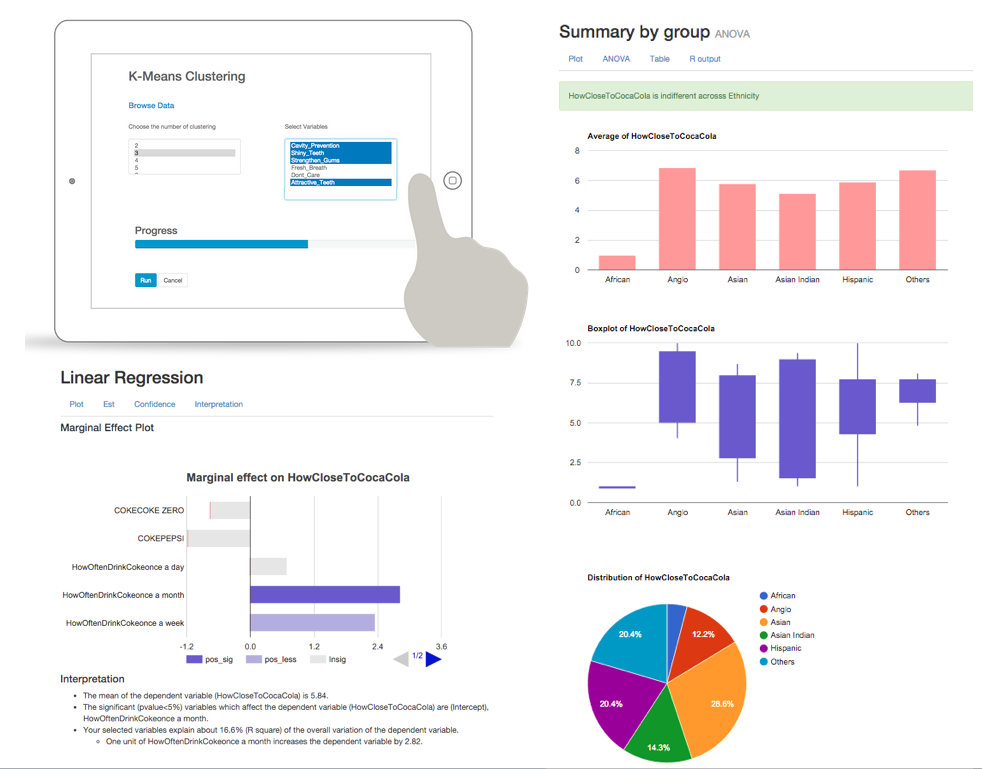
Cluster Analysis is another grouping method, but with a key difference. Unlike discriminant analysis, we don't know the groups beforehand. Cluster analysis explores the data to find natural groupings, or 'clusters', of similar observations. An e-commerce company might use this to segment its customers into different personas (e.g., 'budget shoppers', 'brand loyalists') based on their purchasing habits, without deciding on those categories in advance.
Relating Sets of Variables
What if you have two distinct sets of variables and you want to understand the relationship between them? For instance, you might have one set of variables describing a student's study habits (hours studied, number of practice exams) and another set describing their academic performance (GPA, exam scores).
Canonical Correlation Analysis (CCA) is designed for this exact scenario. It finds the best way to combine the variables in each set to create a new pair of 'canonical variables'. These new variables are constructed to have the maximum possible correlation with each other. In essence, CCA helps you find the strongest link between the overall concept of 'study habits' and the overall concept of 'academic performance'.
CCA boils down the relationship between two groups of variables into its strongest, most essential connection.
By understanding these multivariate techniques, you can move beyond simple one-to-one comparisons and start to appreciate the rich, complex webs of relationships that define real-world data.
What is the primary goal of Principal Component Analysis (PCA)?
An e-commerce company wants to segment its customers into distinct groups based on purchasing behavior (like frequency, items bought, and total spending), but it does not have any predefined categories for these groups. Which multivariate technique is most appropriate for this task?