Advanced On-Chain Trading with Santiment
Introduction to On-Chain Analysis
Reading the Public Ledger
Every transaction on a cryptocurrency network like Bitcoin or Ethereum is recorded on a public, distributed ledger called a blockchain. Think of it as a massive, shared digital receipt book that anyone can look at. On-chain analysis is simply the practice of reading this receipt book to understand what's happening within the network.
This is a radical departure from traditional finance. You can't just pull up a public record of every dollar changing hands. But with crypto, all that data—transactions, wallet balances, network activity—is out in the open. By analyzing this information directly from the source, we can get a clearer picture of market sentiment, investor behavior, and the overall health of a network.
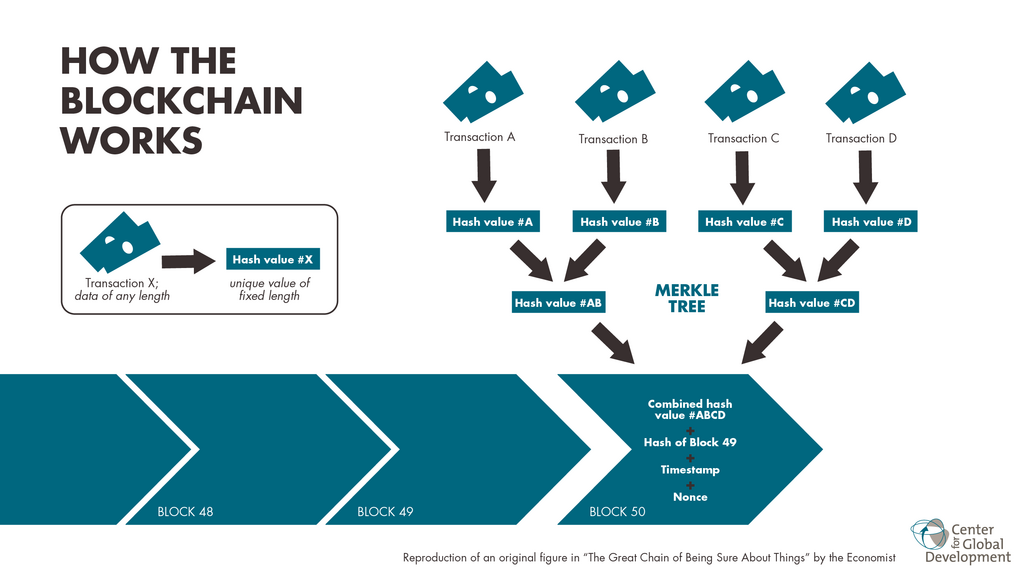
This transparency allows us to move beyond price charts and speculation to see the underlying economic activity. Are people actively using the network? Are large holders accumulating more coins or selling them off? These are the kinds of questions on-chain analysis can help answer.
Key Metrics to Watch
On-chain data is vast, so analysts focus on key metrics to find meaningful signals. These indicators help translate raw transaction data into insights about network usage and investor sentiment.
Active Addresses: This is the number of unique wallet addresses that sent or received a cryptocurrency over a specific period, like a day or a week. A rising number of active addresses suggests growing user adoption and network engagement. A decline might indicate waning interest.
Think of it like tracking daily active users for an app. More users generally mean a healthier, more valuable network.
Transaction Volume: This metric measures the total value of cryptocurrency transferred on the network. It tells you how much economic activity is taking place. A sustained, high transaction volume can indicate a robust and widely used network, while sudden spikes might correspond to major market events.
Another crucial set of metrics involves exchanges, the platforms where most people buy and sell crypto.
Exchange Inflows/Outflows: This tracks the amount of a specific cryptocurrency being moved onto and off of exchanges. A large inflow, where investors move coins to an exchange, can signal an intent to sell. Conversely, a large outflow, where coins are moved from an exchange to a private wallet, often suggests investors are planning to hold for the long term—a potentially bullish sign.
Tools of the Trade
You don't need to be a data scientist to perform on-chain analysis. A growing number of platforms do the heavy lifting of collecting, organizing, and visualizing blockchain data, making it accessible to everyday investors and researchers.
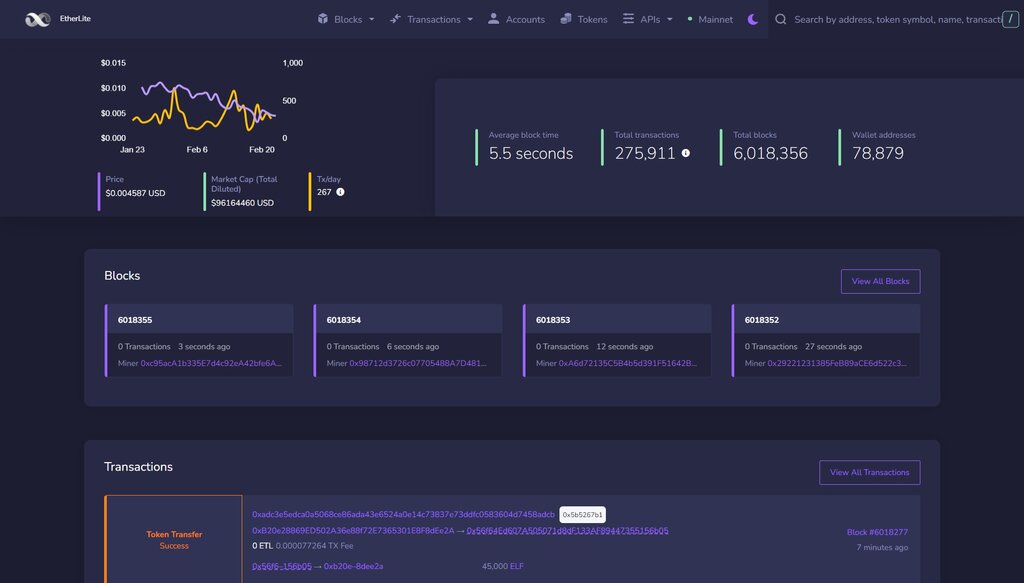
These platforms offer charts and dashboards for all the key metrics we've discussed and many more. Some of the most popular tools include:
- Glassnode: Known for its wide range of sophisticated on-chain metrics and market intelligence reports.
- CryptoQuant: Provides data, particularly on exchange flows, and offers alerts for significant on-chain movements.
- Nansen: Specializes in labeling blockchain addresses, helping users track the activities of specific entities like crypto funds or large-scale investors.
By using these tools, anyone can start exploring the rich data available on the blockchain to form a more complete understanding of the cryptocurrency market.
Ready to test your knowledge on these foundational concepts?
What is the primary goal of on-chain analysis?
On-chain analysis is possible because, unlike in traditional finance, all cryptocurrency transactions are recorded on a public, accessible ledger.