Advanced Injection Molding Techniques and Process Design
Polymer Rheology Dynamics
Flow Under Pressure
When you heat a thermoplastic resin for injection molding, it doesn't just melt into a simple liquid like water. It becomes a thick, viscous fluid with complex behaviors. Rheology is the study of this flow, and understanding it is the key to mastering injection molding. How a polymer behaves under the intense heat and pressure inside the barrel and mold determines everything from fill time to the final part's quality.
The core challenge is that a polymer's resistance to flow, its viscosity, isn't constant. It changes dramatically depending on how fast you try to push it. This is fundamentally different from simple fluids like water or oil, which have a relatively consistent viscosity under similar conditions.
Measuring Viscosity
To control a process, you first need to measure it. In polymer processing, there are two common methods for characterizing flow: the Melt Flow Index (MFI) and capillary rheometry.
MFI is a simple, single-point measurement. A standard weight pushes molten polymer through a small hole (a die) at a specific temperature. The result is the mass of polymer, in grams, that flows out in 10 minutes. It’s a quick and easy test, making it great for quality control to check if a new batch of resin is consistent with the last one. However, it only gives you one data point at a very low, fixed shear rate. It doesn't capture the full picture of how the material will behave under the dynamic conditions of injection molding.
Capillary rheometry is the more comprehensive method. A piston pushes the molten polymer through a capillary die at various controlled speeds, measuring the pressure required for each speed. This process generates a viscosity curve, showing how the material's viscosity changes across a wide range of shear rates and temperatures. This detailed data is essential for accurate process simulation and for predicting how the polymer will flow into complex mold geometries at high speeds.
The Shear-Thinning Effect
Most thermoplastics exhibit a behavior called shear-thinning, or pseudoplasticity. This means their viscosity decreases as the shear rate increases. In simple terms, the faster you push the polymer, the easier it flows. This property is critical for injection molding. It allows the material to flow rapidly through the narrow gates and thin sections of a mold without requiring impossibly high pressures.
This behavior is rooted in the polymer's molecular structure. In a molten state, thermoplastic polymers are long, chain-like molecules that are randomly coiled and entangled with each other, much like a bowl of spaghetti. This entanglement creates a high resistance to flow, resulting in high viscosity when the material is at rest or moving slowly.
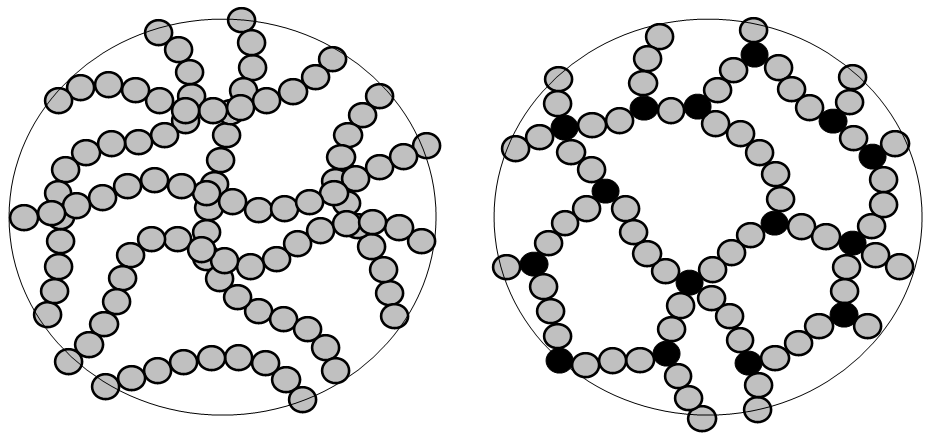
When a shear force is applied, like the pressure from the injection screw, these long chains begin to disentangle and align themselves in the direction of flow. They slide past one another more easily, which reduces the overall internal friction. The higher the shear rate (the faster the flow), the more the chains align, and the lower the viscosity becomes. This orientation of the molecules has a significant impact not just on flow, but also on the mechanical properties of the final, cooled part.
Modeling the Flow
To accurately predict how a polymer will behave in a mold, engineers use mathematical models that describe the relationship between viscosity, shear rate, and temperature. These models are the engines behind mold-flow simulation software. Two widely used models for thermoplastics are the Cross model and the Carreau-Yasuda model, which often includes the Williams-Landel-Ferry (WLF) equation for temperature dependence.
The Cross model is particularly effective at describing the entire viscosity curve, from the flat Newtonian plateau at low shear rates to the shear-thinning region at higher rates.
The Carreau-WLF model provides a similar curve but incorporates the WLF equation to more precisely model how viscosity changes with temperature. This is crucial because the polymer melt cools as it flows through the mold channels, causing its viscosity to increase. An accurate temperature model prevents designers from underestimating the pressure needed to fill the mold or predicting that a section can be filled when it will actually freeze off prematurely.
By fitting rheometry data to these models, engineers can create a digital fingerprint of a specific polymer grade. This allows them to simulate the injection molding process with high fidelity, optimizing fill speeds, gate locations, and processing parameters to produce high-quality parts efficiently and consistently.
What is the primary characteristic of a thermoplastic resin's viscosity, a behavior known as shear-thinning or pseudoplasticity?
A quality control technician needs to perform a quick, simple test to ensure a new batch of resin is consistent with previous ones. Which method is best suited for this purpose?
Understanding these rheological principles is essential for moving beyond basic machine settings into high-precision process control.