Advanced Forex Trading Strategies
Advanced Indicator Synthesis
Synthesizing Advanced Indicators
Relying on a single technical indicator is like navigating with only a compass. It gives you a direction, but you're missing the map, the weather forecast, and the terrain. Advanced analysis moves beyond isolated signals to synthesize multiple data points. The goal is to build a high-probability trading case by looking for confirmation across different types of indicators, each with its own strengths and weaknesses.
Good practice blends multiple indicators, validates signals with volume and higher-timeframe context, and recognizes limitations like false breakouts and changing market regimes.
We'll explore how to combine indicators that measure trend, momentum, and volatility to filter out market noise. This layered approach helps confirm setups and avoid false signals, which is critical for consistent trading.
The Ichimoku Cloud
The Ichimoku Kinko Hyo (or 'one-look equilibrium chart') offers a comprehensive snapshot of the market. Instead of separate indicators, it integrates five components into a single, cohesive view of trend, momentum, and future support or resistance zones. It's designed to be interpreted holistically.
A primary bullish signal occurs when:
- Price is above the Kumo (the cloud).
- The Tenkan-sen (fast line) is above the Kijun-sen (slow line).
- The Chikou Span (lagging span) is above the price from 26 periods ago.
The opposite is true for a bearish signal. The Kumo itself acts as a dynamic zone of support and resistance. A thick cloud suggests strong support or resistance, while a thin cloud indicates weakness.
Fibonacci and Bollinger Bands
While Ichimoku provides a framework, other indicators can refine entry and exit points. Fibonacci retracements are used to identify potential support and resistance levels where a price might reverse or stall. After a significant price move (an impulse), prices often 'retrace' a portion of that move before continuing in the original direction.
Traders watch the 38.2%, 50%, and 61.8% levels closely for potential entries. Fibonacci extensions project where price might go after a retracement, providing logical levels for taking profit. Common extension levels are 127.2%, 161.8%, and 261.8%.
complement this by measuring volatility. The bands widen when volatility is high and contract when it's low. A period of low volatility and tight bands, known as a 'squeeze,' often precedes a significant price breakout. Traders look for a price to close outside the bands to signal the start of a new move.
Multi-Timeframe Synthesis
The most robust signals appear when multiple timeframes align. A professional approach often involves a top-down analysis, confirming a trade setup across daily, 4-hour, and 1-hour charts. This is known as trend synchronization and it helps traders avoid entering positions that are against the dominant market flow.
Multi-time frame analysis is a powerful technique that combines the "big picture" view from higher time frames with precise entry points from lower time frames, reducing false signals.
Here's a common framework:
-
Daily Chart (The Trend): Use this to establish the primary trend direction. Is the price above the Ichimoku cloud? Are the long-term moving averages pointing up or down?
-
4-Hour Chart (The Setup): Look for a setup that aligns with the daily trend. This could be a pullback to a Fibonacci level or the Kijun-sen.
-
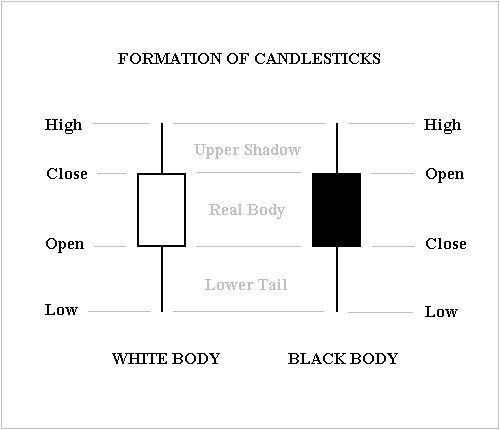
1-Hour Chart (The Entry): Use this for precise entry timing. Wait for a Bollinger Band breakout or a bullish candlestick pattern that confirms the move you identified on the 4-hour chart.
By requiring confirmation across indicators and timeframes, you create a robust filtering system. A bullish divergence on the RSI on the 4-hour chart is far more powerful if it occurs at a 61.8% Fibonacci retracement level while the price is still above the daily Ichimoku cloud. This synthesis of signals is the cornerstone of advanced technical trading.
Time to test your knowledge on synthesizing these tools.
Why is relying on a single technical indicator often insufficient for making consistent trading decisions?
According to the Ichimoku Kinko Hyo system, which of the following conditions represents a primary bullish signal?
Combining these techniques allows you to build a comprehensive view of the market, moving from simple signals to a nuanced, multi-layered strategy.