Advanced Forex Trading Strategies
Advanced Technical Analysis
Combining Advanced Signals
You've learned the basics of reading charts. Now it's time to go deeper. Advanced technical analysis isn't about finding one perfect indicator. It's about combining multiple sophisticated tools to get a clearer picture of market sentiment and probability. We'll move beyond simple patterns and averages to explore techniques that can provide a more nuanced view of price action.
Combine Multiple Technical Analysis Tools: Utilize a combination of chart patterns, trendlines, support, and resistance levels, moving averages, and oscillators to enhance the accuracy of your market analysis and trading decisions.
Harmonic Patterns
Harmonic patterns are complex geometric structures based on Fibonacci ratios. Unlike simpler patterns, they are defined by precise measurements, which helps remove some of the guesswork in trading. They identify potential price reversal zones with a high degree of accuracy. Two of the most common harmonic patterns are the Gartley and the Butterfly.
The Gartley pattern is a reversal pattern that includes a distinct ABCD pattern, preceded by a significant high or low point labeled X. It signals a potential change in the current trend.
The Butterfly pattern is similar to the Gartley but is an extension pattern, meaning point D extends beyond the initial starting point X. This pattern often appears at the end of a strong trend and signals a powerful potential reversal.
The Ichimoku Cloud
The Ichimoku Kinko Hyo (or Ichimoku Cloud) is a comprehensive indicator that defines support and resistance, identifies trend direction, and provides trading signals all in one view. It might look complicated, but its components work together to paint a clear picture of market dynamics.
| Component | Calculation | Purpose |
|---|---|---|
| Tenkan-sen (Conversion Line) | (9-period high + 9-period low) / 2 | Measures short-term momentum. |
| Kijun-sen (Base Line) | (26-period high + 26-period low) / 2 | Measures medium-term momentum. |
| Chikou Span (Lagging Span) | Current closing price plotted 26 periods back | Confirms trend and momentum. |
| Senkou Span A (Leading Span A) | (Tenkan-sen + Kijun-sen) / 2 | Forms one edge of the 'Cloud'. |
| Senkou Span B (Leading Span B) | (52-period high + 52-period low) / 2 | Forms the other edge of the 'Cloud'. |
The space between Senkou Span A and Senkou Span B forms the Kumo, or Cloud.
- When price is above the Cloud, the overall trend is bullish.
- When price is inside the Cloud, the market is considered choppy or consolidating.
- When price is below the Cloud, the overall trend is bearish.
The Cloud's color also provides information. When Senkou Span A is above Senkou Span B, the cloud is typically colored green, signaling bullish sentiment. When Span A is below Span B, it's red, signaling bearish sentiment.
Multi-Timeframe Analysis
Looking at a single timeframe is like trying to navigate a city by only looking at one block. You miss the bigger picture. Multi-timeframe analysis involves viewing the same asset across different chart durations to align your trades with the dominant trend.
The general rule is to use a higher timeframe to establish the primary trend and a lower timeframe to pinpoint your entry and exit points.
A common approach is the "Rule of Four," where you select a medium-term timeframe that suits your trading style and then divide it by four to find your short-term chart, and multiply it by four for your long-term chart. For example:
-
Long-Term (e.g., Daily Chart): Identify the main trend. Is the market making higher highs and higher lows (uptrend) or the reverse (downtrend)? You only want to trade in the direction of this trend.
-
Medium-Term (e.g., 4-Hour Chart): Look for corrective moves within the main trend. For an uptrend, this would be a pullback to a support level. For a downtrend, a rally to a resistance level.
-
Short-Term (e.g., 1-Hour Chart): Time your entry. Wait for a candlestick pattern or indicator signal on this timeframe that confirms the end of the correction and the resumption of the primary trend.
Multi-time frame analysis is a powerful technique that combines the "big picture" view from higher time frames with precise entry points from lower time frames, reducing false signals.
Advanced Candlesticks and Fibonacci
Beyond single candles like the Hammer or Doji, traders look for multi-candle patterns that tell a more complete story. The Morning Star is a classic three-candle bullish reversal pattern, often appearing at the bottom of a downtrend. It consists of a large bearish candle, followed by a small-bodied candle that gaps lower, and finally a large bullish candle that closes within the body of the first candle.
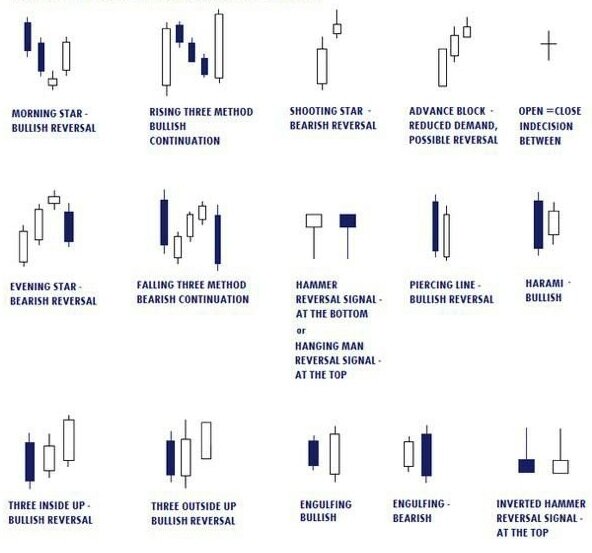
We can enhance candlestick analysis by combining it with Fibonacci levels. Fibonacci tools work because traders watch them, making them self-fulfilling. The two most important are Retracements and Extensions.
Fibonacci Retracement levels act as potential support or resistance. After a strong price move, markets often pull back or "retrace" a portion of that move before continuing in the original direction. Key levels to watch are 38.2%, 50%, and 61.8%.
Fibonacci Extensions are used to project where price might go next, making them useful for setting profit targets. After a retracement, extensions project potential resistance levels if the original trend resumes. Common extension levels are 127.2%, 161.8%, and 261.8%.
The strongest signals often occur when a candlestick pattern forms directly on a key Fibonacci level during a pullback in a clear trend, as confirmed by multi-timeframe analysis. By layering these techniques, you move from simply reacting to price to anticipating it with a structured, probability-based approach.
In Ichimoku Kinko Hyo analysis, what does it signify if the price is trading inside the Kumo, or Cloud?
What is the primary function of Fibonacci Retracement levels in technical analysis?
Mastering these tools takes practice. The goal is to internalize how they work together to build a coherent story about what the market is doing and where it might be headed next.