Advanced Forex Entry and Exit Optimization
Market Microstructure Mapping
The Order Graph
Forget traditional support and resistance. The institutional market is a network, an 'Order Graph,' where price moves between nodes of high-volume liquidity. This network is the interbank market, a decentralized web of Tier 1 banks and financial institutions that forms the true backbone of Forex trading. Retail platforms offer a filtered, delayed view of this reality.
Within this graph, liquidity isn't a simple line on a chart; it's a clustered, dynamic entity. The primary players are major banks and (HFAs) that place significant orders at specific price levels. These clusters of orders are liquidity pools—vast reservoirs of buy-side liquidity (BSL) and sell-side liquidity (SSL) that act as gravitational centers for price. The core of microstructure analysis is mapping these nodes and anticipating price's journey from one pool to the next. Price doesn't just move; it is actively seeking liquidity to facilitate large transactions.
Decoding the Limit Order Book
The Limit Order Book (LOB) is the map to the Order Graph. It provides a real-time, transparent view of market depth by displaying all outstanding limit orders for both buyers (bids) and sellers (asks) at various price levels.
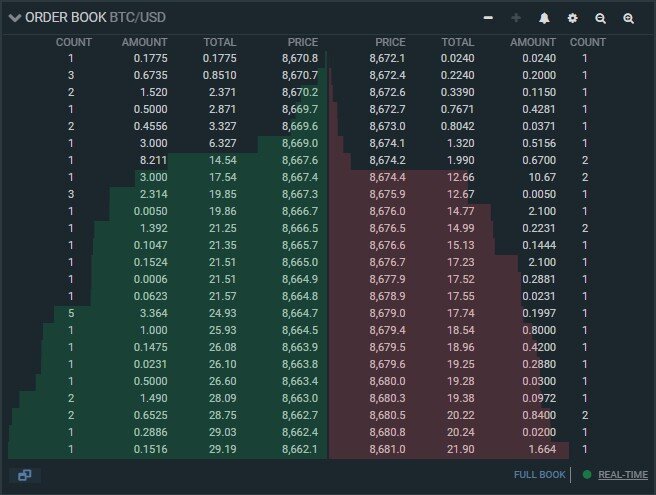
Within the LOB, we see two forces at play: passive and aggressive liquidity.
-
Passive Liquidity: These are the limit orders sitting in the book, waiting to be filled. They represent a willingness to trade at a specific price or better. Large clusters of these orders create the significant BSL and SSL pools. They absorb incoming market orders, acting as temporary brakes on price.
-
Aggressive Liquidity: These are market orders that execute immediately at the best available price. They consume the passive liquidity sitting in the book. A surge in aggressive buying will eat through the sell-side orders (asks), causing the price to rise, and vice-versa.
Price is drawn to deep pools of passive liquidity because that's where large institutions can execute substantial trades without causing excessive slippage. The movement you see on a chart is often simply the result of aggressive orders consuming layers of passive orders until a major liquidity pool is reached, where a potential reversal or absorption event can occur.
Market Maker Spreads
Market makers (MMs) are the agents responsible for maintaining a fluid market. They simultaneously post bid and ask orders, profiting from the spread. Their algorithms are not simple; they dynamically adjust spreads based on volatility, inventory risk, and perceived order flow toxicity. When they detect heavy one-sided aggressive flow (e.g., a large institutional buy), their algorithms will widen the spread to discourage further trading in that direction and shift their quote to manage inventory risk.
Understanding MM behavior is critical. If you see spreads widening and quotes being pulled from one side of the book, it's often a sign that MMs are reacting to significant, unseen order flow. They are not predicting price; they are reacting to the pressure of institutional orders. Observing these subtle shifts in the LOB can provide clues about the intentions of larger market participants before the price move is fully apparent on a standard chart. This is also an environment where manipulative practices like can occur, designed to create false impressions of liquidity.
Market microstructure deals with issues of market structure and design, price formation, price discovery, transaction and timing cost, information & disclosure, and investor behavior.
Time to review the core concepts. Use these flashcards to solidify your understanding of these key market microstructure terms.
According to the 'Order Graph' model, what is the primary driver of price movement in the institutional market?
Which type of liquidity consists of limit orders waiting in the Limit Order Book (LOB) and acts to absorb incoming market orders?
Let's test your ability to apply these concepts.
By viewing the market as a constant search for liquidity rather than a series of patterns, you can align your analysis with the operational reality of institutional trading.