Advanced Financial Management Strategies
Advanced Capital Budgeting
Evaluating Big Bets
Making major investment decisions requires more than just a gut feeling. When a company considers spending millions on a new factory, a product line, or a technology upgrade, it needs a reliable way to gauge whether that bet will pay off. Advanced capital budgeting techniques provide the framework for making these choices, moving beyond simple profit calculations to a deeper analysis of value, time, and risk.
What's a Future Dollar Worth?
The core idea behind modern investment analysis is the time value of money: a dollar today is worth more than a dollar tomorrow. You could invest today's dollar and earn a return on it. Net Present Value (NPV) is a technique that brings this concept to life. It calculates the total value of a project by translating all its expected future cash flows into their equivalent value in today's money.
To do this, NPV discounts those future cash flows using a specific rate, which is typically the company's cost of capital. This rate represents the return the company must earn on an investment to justify the risk. After summing up the present value of all future cash flows, you subtract the initial cost of the project.
The rule is simple: if the NPV is greater than zero, the project is expected to generate more value than it costs, creating wealth for the company. A positive NPV is a green light. A negative NPV suggests the project will earn less than the required rate of return and should be rejected.
NPV is often considered the gold standard in capital budgeting because it provides a direct measure of how much value a project is expected to add to the firm.
Finding the Break-Even Rate
While NPV gives you a dollar value, the Internal Rate of Return (IRR) gives you a percentage. It answers a slightly different question: what is the exact discount rate at which this project breaks even? In technical terms, the IRR is the discount rate that makes the NPV of a project equal to exactly zero.
Think of IRR as the project's intrinsic, annualized rate of return. It's the return you're getting from the investment itself, independent of external market rates.
The decision rule for IRR is to compare it to the company's required rate of return, or hurdle rate. If the IRR is higher than this rate, the project is accepted because it's generating a return greater than the cost of funding it.
However, IRR isn't perfect. For projects with unconventional cash flows (e.g., a large decommissioning cost at the end), there might be multiple IRRs, which can be confusing. It also doesn't work well when comparing mutually exclusive projects of different sizes, as a smaller project might have a higher IRR but a lower NPV, meaning it adds less overall value.
How Soon Do We Get Our Money Back?
The Payback Period is the simplest of the techniques. It asks a straightforward question: how long will it take for the project's cash inflows to equal the initial investment? It's a measure of liquidity and risk, not profitability. A shorter payback period is generally preferred because it means the company's capital is tied up for less time.
| Year | Cash Flow | Cumulative Cash Flow |
|---|---|---|
| 0 | -$100,000 | -$100,000 |
| 1 | $30,000 | -$70,000 |
| 2 | $40,000 | -$30,000 |
| 3 | $50,000 | $20,000 |
In the example above, the investment is paid back sometime during Year 3. To be precise, after Year 2, we still need $30,000. Since Year 3 brings in $50,000, we need $30,000 / $50,000 = 0.6 of that year's cash flow. So, the payback period is 2.6 years.
The main weakness of this method is that it completely ignores the time value of money and any cash flows that occur after the payback period. A project could be highly profitable in its later years, but the payback calculation wouldn't see it.
Risk, Uncertainty, and Financing
All these methods depend on one critical input: cash flow projections. These are just educated guesses about the future, and they're inherently risky. What if sales are lower than expected? What if a key raw material cost skyrockets? This is where risk assessment comes in.
Companies use several techniques to account for this uncertainty:
- Sensitivity Analysis: This involves changing one variable at a time (like sales volume or operating costs) to see how much it impacts the project's NPV or IRR. It helps identify the most critical assumptions.
- Scenario Analysis: Instead of changing one variable, you create multiple scenarios—for example, a pessimistic, optimistic, and most likely case. You then calculate the NPV for each, giving you a range of possible outcomes.
- Risk-Adjusted Discount Rate (RADR): For projects deemed riskier than average, a company might use a higher discount rate. This raises the bar for the project, requiring a higher potential return to compensate for the higher risk.
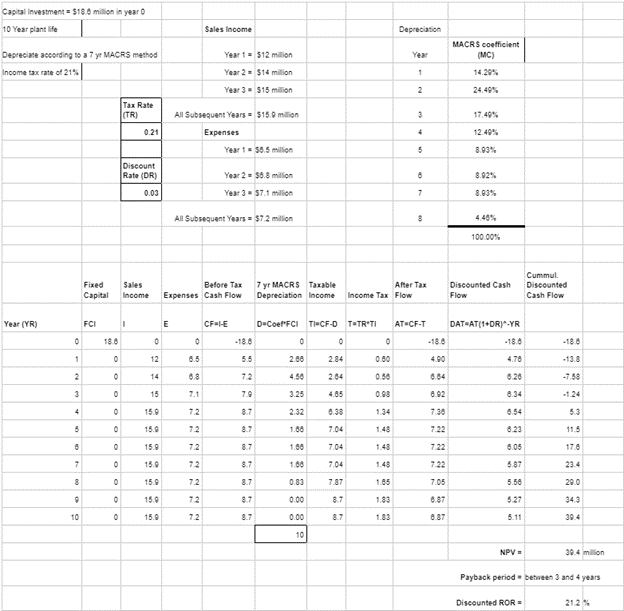
Finally, the way a project is financed has a direct impact on its viability. The discount rate used in an NPV calculation is often the company's Weighted Average Cost of Capital (WACC), which is a blend of the cost of its debt and equity. If a company takes on more debt to fund a project, its WACC might change. A higher cost of capital means future cash flows are discounted more heavily, which lowers the project's NPV. Therefore, financing decisions and investment decisions are deeply intertwined.
Time to test your understanding of these core concepts.
What does a positive Net Present Value (NPV) indicate about an investment project?
The primary weakness of the Payback Period method is that it ignores cash flows that occur after the payback period has been reached.
By mastering these tools, financial managers can make strategic, data-driven decisions that steer their companies toward long-term growth and profitability.