Advanced Cardiovascular Physiology and Function
Integrated Cardiac Mechanics
The Heart's Symphony
The cardiac cycle isn't just a simple pump; it's a precisely timed sequence of mechanical and electrical events. To see how these events align, cardiologists use a tool that looks complex but tells a clear story: the Wiggers diagram. It layers pressure changes, volume shifts, heart sounds, and electrical signals onto a single timeline, revealing the cause-and-effect relationships that define each heartbeat.
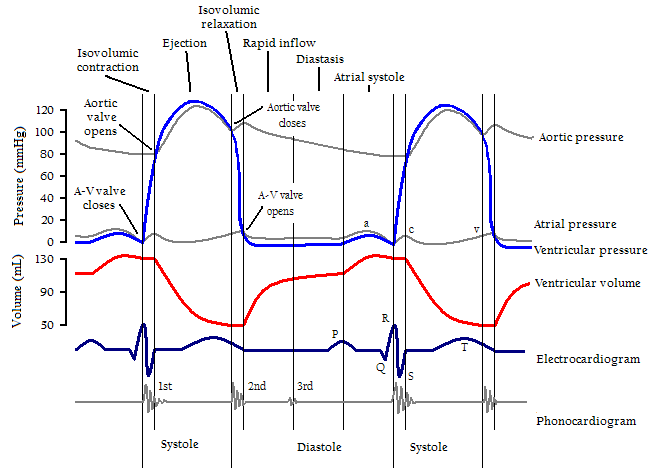
Look at the various lines. You can see the pressure rising and falling in the aorta, the left ventricle, and the left atrium. Below that, you see the volume of the left ventricle changing. The electrocardiogram (ECG) at the bottom shows the electrical signal that triggers the muscle contraction, and the phonocardiogram shows the heart sounds. Every peak and valley is connected.
Pressure Gradients Rule Everything
Valves in the heart don't have their own muscles; they are passive flaps that open and close based on one thing: pressure differences. When pressure is higher behind the valve, it opens. When pressure is higher in front of it, it snaps shut. This simple principle governs the entire flow of blood.
The cycle begins with the atria contracting, pushing a final bit of blood into the ventricles. This is the 'atrial kick'. Shortly after, the ventricles begin to contract. As ventricular pressure quickly rises above atrial pressure, the atrioventricular (AV) valves close. This closure creates the first heart sound, S1, the "lub" of the "lub-dub."
This moment kicks off a crucial phase called isovolumetric contraction . The ventricles are contracting, but both the AV and aortic valves are closed. Because all exits are sealed, the muscle fibers generate enormous tension without changing the volume of blood inside. The pressure skyrockets.
Once ventricular pressure climbs higher than the pressure in the aorta, the aortic valve is forced open, and the ejection phase begins. Blood surges out of the ventricle. As the ventricle finishes its contraction and starts to relax, its pressure falls rapidly. The moment it drops below the aortic pressure, the back pressure in the aorta slams the aortic valve shut. This causes the second heart sound, S2, or the "dub."
This initiates the next phase: isovolumetric relaxation. Once again, all valves are closed. The ventricle relaxes, and its pressure plummets, but the volume of blood inside doesn't change. When the ventricular pressure drops below the atrial pressure—which has been passively filling with blood from the lungs—the AV valves open, and the process of ventricular filling starts all over again.
Measuring Performance
To gauge how well the heart is working, we can't just listen to sounds. We need to quantify its output. This starts by measuring the volume of blood in the ventricle at two key points. The maximum volume, right after the ventricle has filled, is the end-diastolic volume, or EDV. The amount of blood left in the ventricle after it has contracted is the end-systolic volume, or ESV.
Stroke volume tells us how much blood is pumped per beat. A typical resting stroke volume is about 70 mL. But a more telling metric is what percentage of the blood is actually pumped out. This is the Ejection Fraction (EF). A healthy heart doesn't—and shouldn't—eject all of its blood.
Ejection fraction is one of the most important indicators of heart health. A low EF is a hallmark of heart failure, indicating the heart muscle is too weak to pump blood effectively.
Finally, to understand the heart's total work over time, we calculate Cardiac Output (CO). This is the total volume of blood the heart pumps per minute. It's a simple product of how much blood is pumped per beat and how many beats there are per minute.
These quantitative measures—SV, EF, and CO—are the language doctors use to assess cardiac function. They are all derived from the fundamental mechanical events of the cardiac cycle, all driven by the relentless rhythm of changing pressures.
What is the primary purpose of a Wiggers diagram in cardiology?
What fundamental principle governs the opening and closing of heart valves?