Advanced Cardiac Physiology and Clinical Applications
Advanced Cardiac Mechanics
The Cardiac Cycle in Motion
The heart's function isn't just a simple pump; it's a sophisticated cycle of pressure and volume changes that work in perfect concert. To understand how the heart adapts to the body's needs, we need to look beyond the basic path of blood flow and analyze the mechanical events that drive it. The Wiggers diagram is a classic tool that synchronizes all the key events of the left ventricle over a single heartbeat.
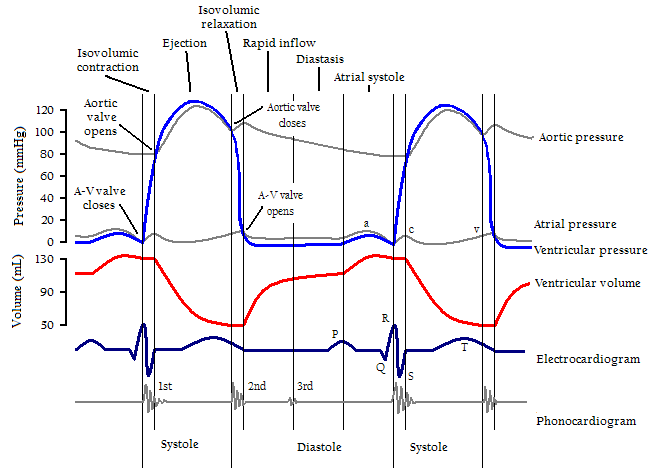
Let's break down the cycle shown in the diagram:
- Ventricular Filling (Diastole): This starts when the mitral valve opens, allowing blood from the left atrium to fill the left ventricle. Atrial contraction, prompted by the P wave on the ECG, gives a final push of blood into the ventricle.
- Isovolumetric Contraction (Systole): The QRS complex on the ECG triggers ventricular contraction. Pressure inside the ventricle rises sharply. This pressure forces the mitral valve shut, creating the first heart sound (S1). Since the aortic valve is also closed, the volume of blood in the ventricle doesn't change, hence the term "isovolumetric."
- Ejection (Systole): Once ventricular pressure exceeds aortic pressure, the aortic valve opens, and blood is rapidly ejected into the aorta. Ventricular volume plummets.
- Isovolumetric Relaxation (Diastole): As the ventricle relaxes after ejecting blood, its pressure falls below the aortic pressure. This causes the aortic valve to snap shut, producing the second heart sound (S2). Both the mitral and aortic valves are closed again, so ventricular volume remains constant while the pressure continues to drop.
Pressure-Volume Loops
While the Wiggers diagram plots events against time, a Pressure-Volume (PV) loop offers a different perspective. It charts left ventricular pressure against its volume through one complete cardiac cycle. This view powerfully illustrates the work done by the heart with each beat.
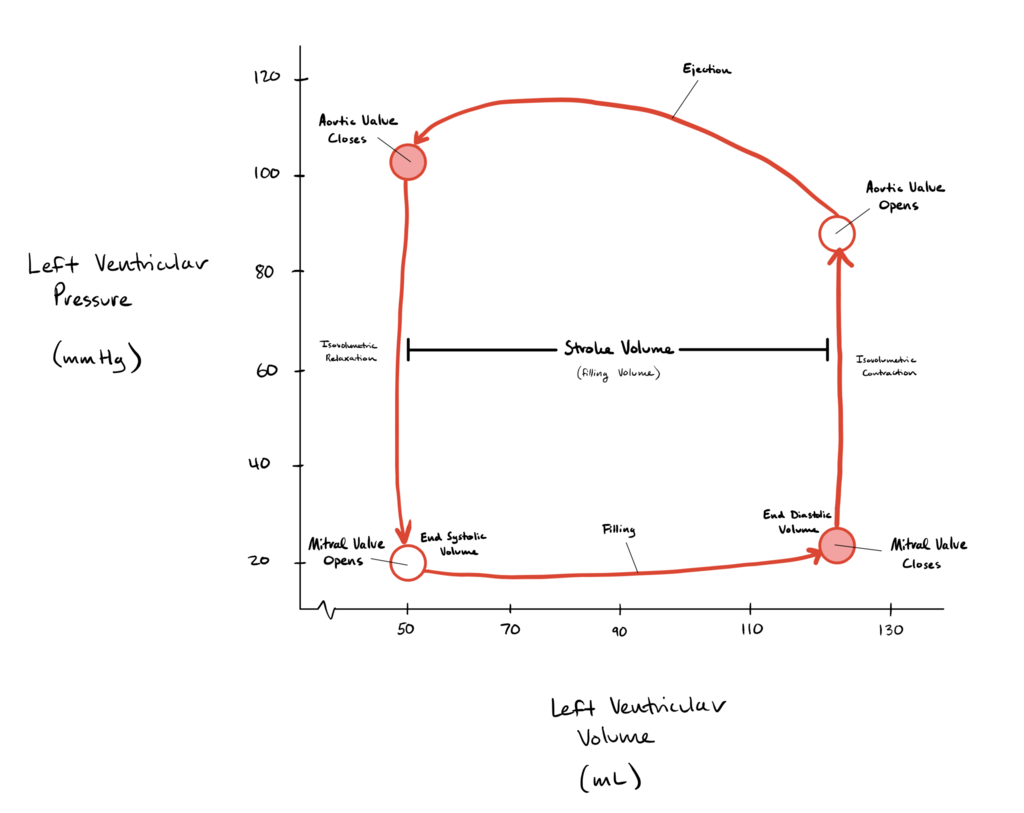
The loop moves counter-clockwise, and each segment corresponds to a phase of the cardiac cycle:
- Filling: The bottom line shows the ventricle filling with blood at low pressure. The volume at the end of this phase is the End-Diastolic Volume (EDV).
- Isovolumetric Contraction: The vertical line on the right shows pressure skyrocketing with no change in volume.
- Ejection: The top curve represents the ventricle ejecting blood. Pressure rises slightly then falls as the ventricle empties. The volume remaining at the end is the End-Systolic Volume (ESV).
- Isovolumetric Relaxation: The vertical line on the left shows pressure falling dramatically, again with no change in volume, returning to the starting point.
The width of the loop represents the stroke volume (), and the area inside the entire loop represents the total mechanical work, or stroke work, performed by the ventricle in that single beat.
Adapting to Demand
The heart isn't static; it constantly adjusts its output. The PV loop is an excellent tool for visualizing how it responds to changes in preload, afterload, and contractility.
Preload is the stretch on the ventricular muscle fibers at the end of diastole. Think of it as how full the ventricle is just before it contracts. It's primarily determined by the End-Diastolic Volume (EDV).
Afterload is the pressure the ventricle must overcome to eject blood. It's the load the heart works against, largely represented by aortic pressure.
The Frank-Starling mechanism describes how the heart intrinsically adapts to changes in preload. Essentially, the more the ventricle is stretched by incoming blood (increased preload), the more forcefully it contracts. This ensures that the heart automatically pumps out the volume of blood it receives.
Frank-Starling relationship (ventricular function curve): SV increases with increased preload (EDV). Increased preload increases force of contraction.
On a PV loop, an increase in preload (a higher EDV) shifts the bottom-right corner of the loop to the right. Because of the Frank-Starling mechanism, this leads to a stronger contraction and a larger stroke volume, widening the loop.
Increased afterload makes it harder for the heart to pump blood out. On the PV loop, this appears as a taller, narrower loop. The ventricle has to generate more pressure to open the aortic valve, and it can't eject as much blood, so the stroke volume decreases.
Contractility and Wall Stress
Beyond preload and afterload, the heart has an intrinsic ability to change its force of contraction. This is called inotropy (contractility). An increase in inotropy, perhaps from adrenaline, means the heart contracts more forcefully at any given preload. On the PV loop, this shifts the top-left corner upwards and to the left, resulting in a wider loop and a greater stroke volume.
Conversely, lusitropy refers to the rate of myocardial relaxation. Improved lusitropy allows the ventricle to relax faster, enabling it to fill more effectively, especially at high heart rates.
The force the heart muscle generates is related to the stress within its walls. The Law of Laplace provides a simplified model for understanding this relationship in a spherical ventricle.
This law explains a critical long-term adaptation. In conditions of chronic high pressure (like hypertension), afterload is consistently high. To reduce the resulting high wall stress (), the heart muscle hypertrophies, increasing its wall thickness (). While this is a useful short-term compensation, prolonged hypertrophy can make the ventricle stiff and less efficient, contributing to the development of heart failure.
Let's test your understanding of these advanced cardiac mechanics.
During which phase of the cardiac cycle are both the mitral and aortic valves closed while the ventricle is contracting?
An increase in preload, according to the Frank-Starling mechanism, will have what effect on the Pressure-Volume (PV) loop?
Understanding these mechanical relationships is key to diagnosing and managing cardiovascular disease. They explain how the heart adapts to exercise, stress, and the early stages of disease.