Advanced ABAP Debugging Techniques
New Debugger Navigation
The New Debugger Workbench
You've written your ABAP code, but it isn't behaving as expected. It's time to debug. While the classic debugger gets the job done, the New ABAP Debugger is a significant upgrade. Think of it less as a tool and more as a customizable workbench. You can access it directly using the transaction code SAS or by setting a breakpoint and running your program.
The key difference is flexibility. The new debugger allows you to arrange your screen with exactly the tools you need, right where you need them.
When you first enter the new debugger, you'll see a default layout. This is typically split into a few key areas: the source code view, a variable display, and other tools. The entire interface is built around the concept of 'Desktops'. You start on Desktop 1, but you have two more, Desktop 2 and Desktop 3, that you can switch between. This lets you set up different views for different tasks. For example, Desktop 1 could be your main code and variable view, while Desktop 2 is set up to watch complex internal tables.
Customising Your Layout
The real power comes from customisation. You are not stuck with the default layout. You can add, remove, and resize tools to fit your workflow. Want to see the call stack next to your local variables? No problem. Need a bigger window for a specific internal table? Just drag the window border.
To add a new tool, use the 'New Tool' button in the toolbar. A dialogue will appear with a list of available tools, such as:
- Variable Fast Display: For a quick look at the contents of variables.
- Call Stack: To see the sequence of program calls that led to the current point.
- Table Display: For in-depth analysis of internal tables.
- Object Display: For inspecting attributes and methods of an object.
Once you have a layout you like, you can save it. Click the 'Save Layout' button and give your configuration a name. This saved layout is called a debugger variant. You can create different variants for different types of debugging tasks. For instance, you might have one variant for checking simple variables and another for analysing complex object-oriented programs.
Session vs External Debugging
You'll encounter two main types of breakpoints: session and external. A session breakpoint is temporary and only active for your current login session. Once you log out, it's gone. This is great for quick, one-off debugging tasks.
An external breakpoint, however, is user-specific and persistent. It remains active even after you log out and back in. This is crucial for debugging processes that are triggered by external systems or run under a different user ID, like an RFC call or a background job. The debugger will activate for the specified user whenever that piece of code is executed.
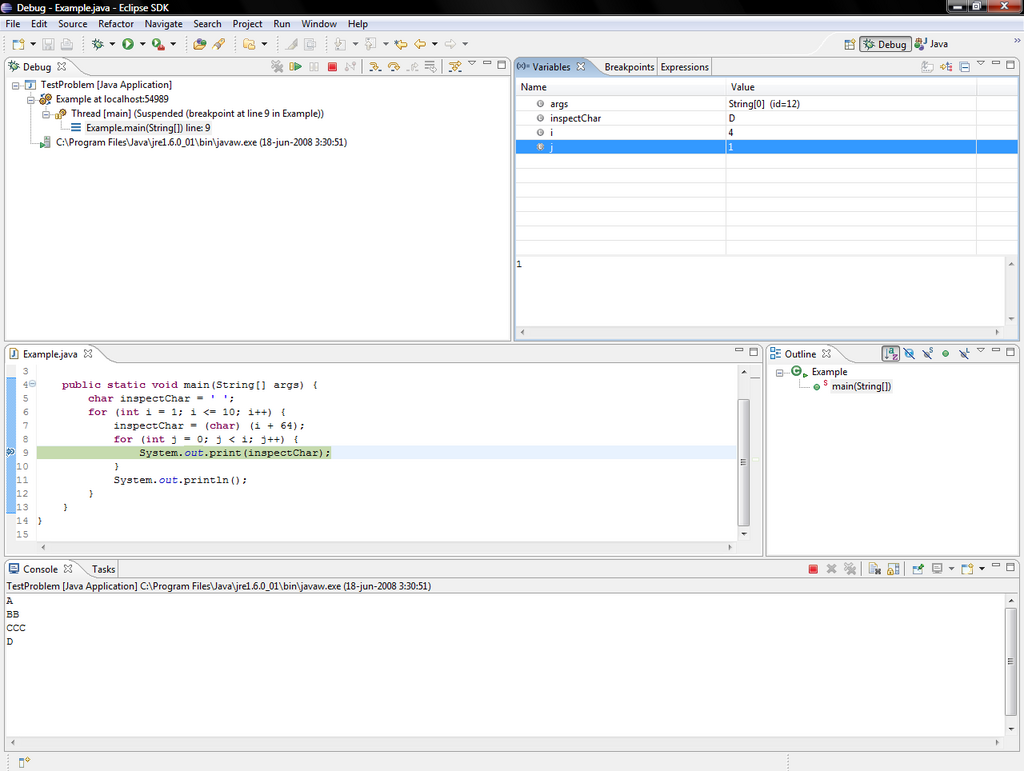
Mastering the layout and tools of the New ABAP Debugger will save you a huge amount of time. Instead of hunting for information across different screens, you can build a focused workbench that shows you exactly what you need to solve the problem at hand.
Get comfortable with the debugging tools in ABAP.
Now, let's test your understanding of the debugger's interface.
What is the primary advantage of using 'Desktops' within the New ABAP Debugger?
You need to debug an issue that only occurs when a background job, running under a different user ID, executes your code. You will not be logged into the system when the job runs. Which type of breakpoint is suitable for this situation?
Getting comfortable with these tools is the first step towards becoming a proficient troubleshooter.