Active Trading Strategies and Market Execution
Technical Analysis Foundations
Reading the Market's Story
Price charts tell a story about the battle between buyers and sellers. While basic candlestick patterns like dojis and hammers offer clues, more complex patterns can reveal deeper insights into market psychology. One such pattern is the 'Engulfing' pattern. A Bullish Engulfing pattern occurs when a small red candle is completely swallowed or 'engulfed' by a larger green candle, suggesting a strong shift in momentum from sellers to buyers. The opposite, a Bearish Engulfing pattern, signals a potential top as sellers overwhelm buyers.
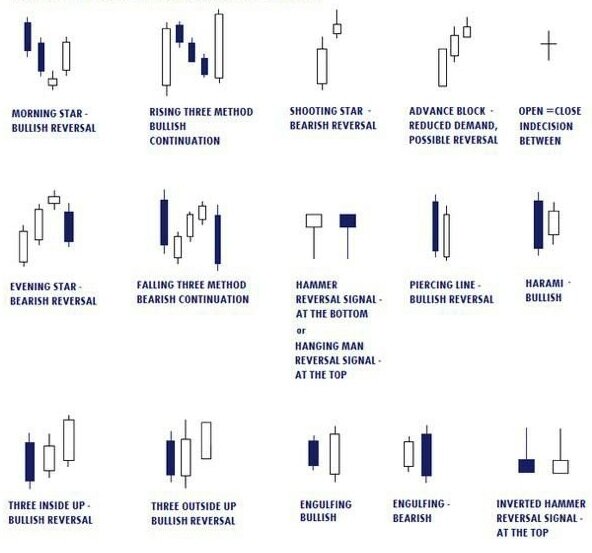
Another powerful formation is the 'Morning Star', a three-candle bullish reversal pattern. It starts with a large red candle, followed by a small-bodied candle (or a doji) that gaps down, and finishes with a large green candle that closes at least halfway up the first red candle. This sequence shows sellers losing control, a period of indecision, and then buyers stepping in with force. Its bearish counterpart is the 'Evening Star'. Recognising these advanced patterns helps you anticipate potential trend changes before they become obvious.
The Trend Is Your Friend
The core idea of technical analysis is that prices move in trends. This concept was formalised by over a century ago, and his ideas form the bedrock of what we now call Dow Theory. He proposed that the market has three simultaneous trends: primary, secondary, and minor.
The primary trend is the main long-term direction, lasting from a year to several years. The secondary trend is a corrective move against the primary trend, lasting weeks to months. The minor trend consists of daily fluctuations that last from a few days to a few weeks.
To visualise these trends, we draw trendlines. For an uptrend, draw a line connecting a series of higher lows (the bottom of each dip). For a downtrend, connect a series of lower highs (the peak of each rally). A trend is considered intact as long as the price respects this line. A decisive break through the trendline often signals a change in direction. Markets that aren't trending are said to be 'ranging', moving sideways between two horizontal boundaries.
Floors and Ceilings
A ranging market is defined by support and resistance. Support is a price level where buying pressure is strong enough to overcome selling pressure and halt a downtrend. Think of it as a floor. Resistance is the opposite: a price level where selling pressure overcomes buying pressure, acting as a ceiling.
These zones are not exact lines, but rather areas where the price has previously pivoted. The more times a support or resistance level is tested and holds, the more significant it becomes. A key principle is that once a resistance level is broken, it can become a new support level. Similarly, when support is broken, it can turn into resistance.
The final piece of the puzzle is volume. Volume represents the number of shares traded during a specific period. It's a gauge of conviction. A price move accompanied by high volume is more significant than one with low volume. For example, if a stock breaks above a resistance level on a huge spike in volume, it suggests strong commitment from buyers and increases the probability that the breakout is legitimate.
This idea is central to (VSA), which interprets the relationship between price (the spread of a candle), volume, and the closing price. VSA seeks to determine if large institutional players—often called 'smart money'—are accumulating (buying) or distributing (selling) shares. High volume on a narrow price spread after a long uptrend, for instance, might signal that institutions are selling shares to eager but uninformed retail buyers, hinting at a potential reversal.
To get started with technical analysis, beginners should begin by studying basic concepts such as support and resistance, trendlines, and chart patterns.
What does a Bullish Engulfing pattern on a price chart typically suggest?
A 'Morning Star' is a three-candle bullish reversal pattern. It begins with a large red candle, followed by a small-bodied candle, and is completed by what?
By combining candlesticks, trends, support, resistance, and volume, you can start to build a more complete picture of the market's behaviour and make more informed trading decisions.