30-Day YouTube Content Strategy
Understanding YouTube Analytics
Your YouTube Dashboard
Creating content is only half the battle. To truly grow your channel, you need to understand what your audience responds to. This is where YouTube Analytics comes in. It's a powerful tool inside YouTube Studio that shows you exactly how your videos are performing and who is watching them.
Think of it as a report card for your content. Instead of just guessing what works, you can look at the data and make informed decisions. The dashboard can seem overwhelming at first, but you only need to focus on a few key numbers to get started.
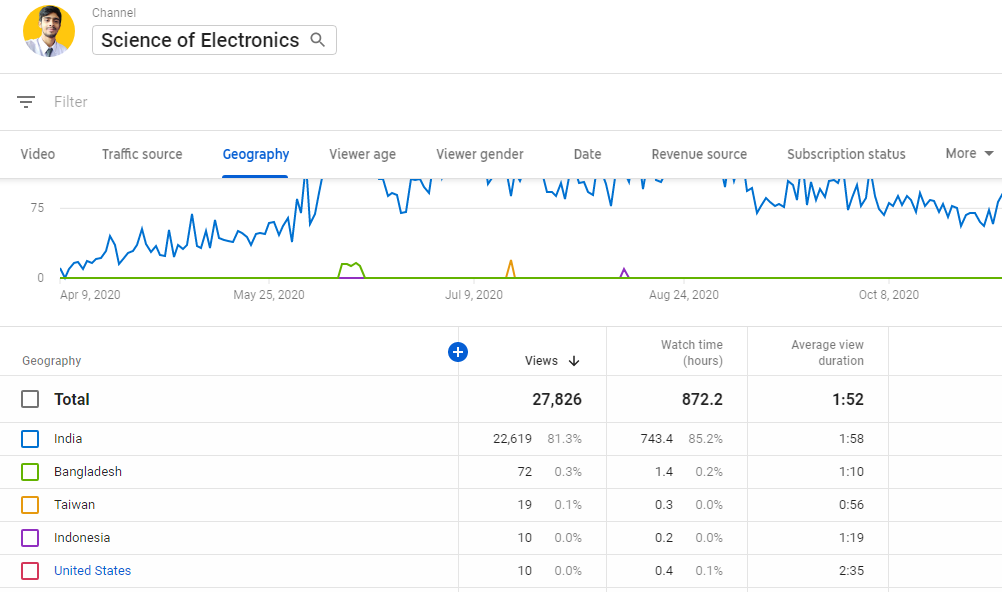
Key Performance Metrics
Let's break down the three most important metrics you should track. These numbers tell a story about how viewers find and interact with your videos.
Watch Time
noun
The total amount of time, in minutes, that viewers have spent watching your videos. It's a primary metric YouTube's algorithm uses to rank content.
A video with millions of views but only a few seconds of watch time per viewer is less valuable to the algorithm than a video with fewer views but a much longer average watch time.
Next up is the Click-Through Rate, or CTR. This metric tells you how compelling your video's first impression is.
Click-Through Rate
noun
The percentage of people who clicked on your video after seeing its thumbnail (an impression) on YouTube. A high CTR means your title and thumbnail are effective at grabbing attention.
Finally, there's Audience Retention. This metric shows you exactly when people stop watching your video. The Audience Retention graph is one of your most powerful tools for improving your content.
A sharp drop at the beginning might mean your intro is too long. A big dip in the middle could signal a boring or confusing section. A gradual slope is what you're aiming for, as it means viewers are staying engaged.
Turning Data into Decisions
Looking at these metrics in isolation is helpful, but their real power comes from seeing how they connect. By analyzing them together, you can diagnose your video's strengths and weaknesses and figure out what to do next.
| Scenario | Possible Meaning | Action to Consider |
|---|---|---|
| High CTR, Low Retention | Your thumbnail and title are great, but the video doesn't deliver on its promise. | Make sure your content matches the hook. Get to the point faster. |
| Low CTR, High Retention | The video is engaging, but the thumbnail and title aren't attracting clicks. | Test new thumbnail designs and write more compelling titles. |
| Low CTR, Low Retention | Both the packaging (title/thumbnail) and the content need improvement. | Re-evaluate the topic and your presentation style. |
| High CTR, High Retention | You've found a winning combination! | Analyze this video and apply its lessons to future content. |
Look for patterns over time. Do videos on a certain topic always get high watch time? Do a particular style of thumbnails consistently get a better CTR? These trends are clues that tell you what your audience wants to see more of.
By routinely analyzing analytics and responding to both quantitative data and viewer feedback, you can optimize your content strategy, improve engagement, and strengthen your channel’s performance over time.
Now, let's review the key terms we've covered.
Ready to test your knowledge? This quiz will help you check your understanding of these core analytics concepts.
What is the primary purpose of YouTube Analytics?
Which metric specifically measures the percentage of people who clicked on your video after seeing its thumbnail and title on YouTube?
By regularly checking these key metrics, you can move from guessing to knowing, creating content that not only you enjoy making, but that your audience loves to watch.