Strategic Market Trading and Execution
Technical Analysis Patterns
Reading the Market's Story
Price charts tell a story about the battle between buyers and sellers. While basic support and resistance lines give you the chapter summaries, chart patterns reveal the plot twists. These formations, created by price movements over time, visualize shifts in market sentiment and can help anticipate where the price might go next. They generally fall into three categories: reversal, continuation, and bilateral.
When the Trend Bends
Reversal patterns suggest that a prevailing trend is running out of steam and may be about to change direction. Two of the most common are the Head and Shoulders and the Double Top/Bottom.
The Head and Shoulders pattern signals a potential shift from an uptrend to a downtrend. It consists of three peaks: a central, highest peak (the head) flanked by two lower peaks (the shoulders). The lows of the pullbacks between these peaks can be connected to form a support line called the neckline.
The story here is one of fading bullish power. The left shoulder is a strong peak in an uptrend. The head makes a higher high, but the subsequent pullback to the neckline shows weakness. The right shoulder's failure to surpass the head is the final clue. A decisive price drop below the neckline is the signal to consider a short position. To set a rough price target, measure the vertical distance from the peak of the head to the neckline and project that distance down from the breakout point.
A Double Top looks like an "M" and signals a potential bearish reversal, while a Double Bottom resembles a "W" and suggests a bullish reversal. They occur when the price tests a support or resistance level twice and fails to break through, indicating the opposing force is taking control.
Pausing for Breath
Continuation patterns are brief periods of consolidation in a trending market. They suggest the market is just taking a breather before continuing its original trajectory. Think of them as commas in the market's story, not periods.
The most common are Flags and Pennants. Both start with a sharp, strong price move called the flagpole. This is followed by a period of consolidation:
- Flag: A rectangular channel that slopes against the prevailing trend.
- Pennant: A small, symmetrical triangle that forms after the flagpole.
The psychology is simple: after a big move, some traders take profits while new ones wait to enter. This creates a temporary equilibrium before the dominant trend reasserts itself with a breakout from the consolidation.
The entry signal is a breakout from the flag or pennant in the same direction as the flagpole. A common way to estimate the price target is to measure the height of the flagpole and project it from the point of the breakout.
Coiled for a Breakout
Some patterns don't signal a clear direction. Bilateral patterns, like Triangles, show a market coiling up with decreasing volatility, suggesting a big move is likely, but the direction isn't confirmed until a breakout happens.
- Ascending Triangle: A flat resistance top and a rising support line. This pattern has a bullish bias, as buyers are progressively more aggressive, but it needs a breakout above resistance for confirmation.
- Descending Triangle: A flat support bottom and a falling resistance line. This has a bearish bias, but requires a breakdown below support to confirm.
- Symmetrical Triangle: Both support and resistance lines are converging. This is a truly neutral pattern where traders wait for the price to dictate the direction.
Confirmation is Key
A pattern is just a possibility until it's confirmed. A common mistake is to trade a pattern before it fully completes. A breakout happens when the price closes decisively outside the pattern's trendline or neckline. Many traders look for a surge in [{
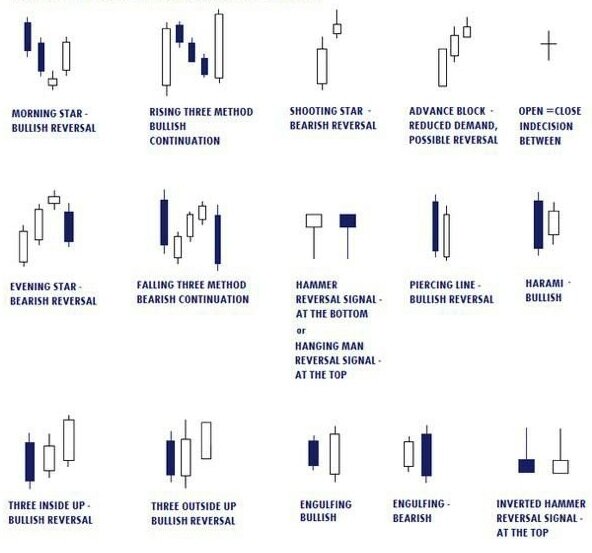
Chart patterns can be used to predict the direction of prices, areas of support or resistance and price breakout and breakdown points.
For example, in a Head and Shoulders pattern, the price might dip below the neckline only to snap back above it. This is a classic fakeout. To mitigate this, some traders wait for a candle to close below the neckline, or even for the price to retest the broken neckline (which now acts as resistance) before entering a trade. Waiting for confirmation means you might miss the very first part of a move, but it significantly increases the probability of being on the right side of the trade.
A pattern that forms after a sharp price move (the flagpole) and looks like a small, symmetrical triangle is known as a:
In a classic Head and Shoulders pattern, what does a decisive price drop below the neckline typically signal?
Recognizing these patterns takes practice. By combining them with other forms of analysis, you can build a more robust framework for interpreting market behavior.