Statistical Analysis for Thesis
Introduction to R and Python
Your Toolkit for Data Analysis
When it comes to analyzing data, R and Python are the two most powerful and popular programming languages available. Think of them as the foundational tools in your statistical workshop. Both are free, open-source, and supported by massive communities.
R was built by statisticians, for statisticians. Its features are specifically designed for statistical analysis and data visualization. If your work is heavily focused on academic research and classical statistical tests, R is often the most direct tool for the job.
Python, on the other hand, is a general-purpose language. You can build websites, automate tasks, and, yes, perform powerful statistical analysis with it. Its simplicity and readability make it a great first language, and its extensive libraries like pandas, NumPy, and scikit-learn make it a data science powerhouse.
The choice isn't about which language is better, but which one is the right fit for your specific task and workflow. Many researchers end up learning both.
Getting Set Up
Before you can start analyzing data, you need to set up your programming environment. This involves installing the language itself and an Integrated Development Environment (IDE), which is a software application that makes coding much easier.
For R: Install R and RStudio
- Install R: First, you need the core language. Go to the official R Project website and download the installer for your operating system (Windows, macOS, or Linux).
- Install RStudio: RStudio is the most popular IDE for R. It provides a code editor, a console to run commands, and windows for viewing plots, variables, and help files. Download the free RStudio Desktop version from their website and install it after you've installed R.
For Python: Install the Anaconda Distribution
The easiest way to get started with Python for data analysis is by installing the Anaconda Distribution. It bundles Python with Jupyter Notebook and hundreds of essential data science libraries, so you don't have to install them one by one.
- Go to the Anaconda website.
- Download the installer for your operating system.
- Run the installer, following the on-screen instructions.
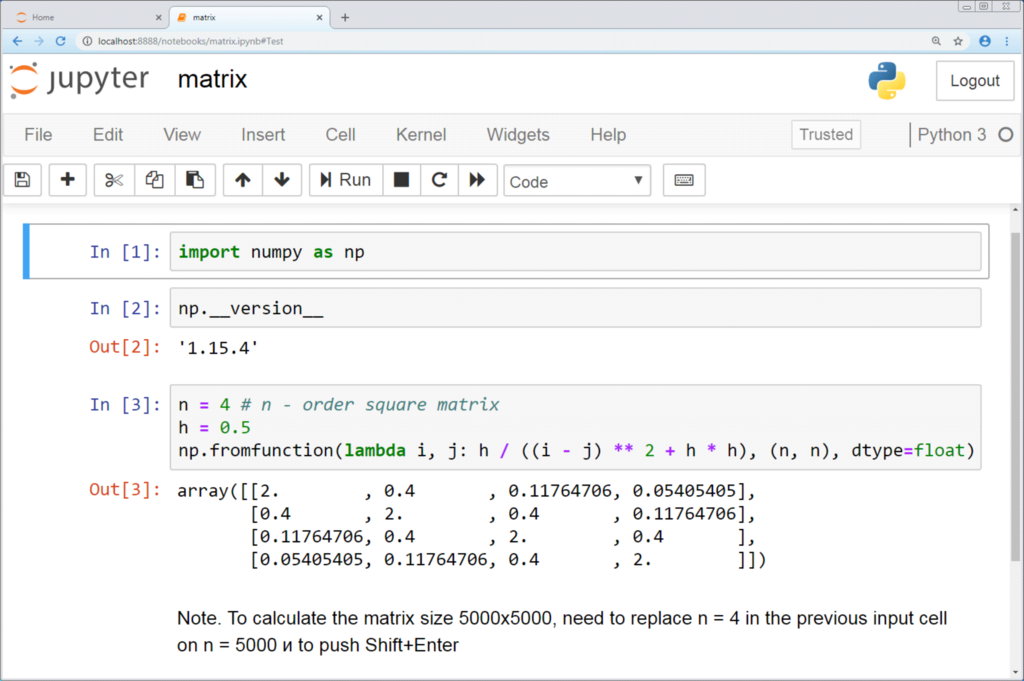
Once Anaconda is installed, you can launch Jupyter Notebook, which opens in your web browser. It allows you to create documents that contain live code, equations, visualizations, and narrative text, making it perfect for exploring data.
Speaking the Languages
Now that you have your tools, let's learn a few basic phrases in each language. We'll start with creating variables to store information and performing simple math.
Basics in R
In R, you assign a value to a variable using the <- operator. It looks like an arrow and helps you remember that you're putting the value on the right into the variable on the left.
# R

# Assign the value 10 to a variable named 'x'
x <- 10

# Assign the value 5 to a variable named 'y'
y <- 5

# Perform some math
sum_result <- x + y       # Result is 15
difference <- x - y    # Result is 10
product <- x * y       # Result is 50
quotient <- x / y      # Result is 2

# To see the value of a variable, just type its name
sum_result
R has a few basic data types you'll encounter constantly:
- Numeric: Numbers, like
10or3.14. - Character: Text, also known as strings. You must wrap them in quotes, like
"hello". - Logical: Represents TRUE or FALSE.
The most basic data structure in R is a vector. You can think of it as a list of items of the same type. You create a vector using the c() function, which stands for "combine".
# R

# A numeric vector
ages <- c(25, 30, 22, 45)

# A character vector
names <- c("Alice", "Bob", "Charlie")

# A logical vector
is_student <- c(TRUE, FALSE, TRUE)
Basics in Python
In Python, assignment is simpler. You just use the equals sign = to assign a value to a variable. The arithmetic operations are identical to R.
# Python

# Assign the value 10 to a variable named 'x'
x = 10

# Assign the value 5 to a variable named 'y'
y = 5

# Perform some math
sum_result = x + y       # Result is 15
difference = x - y    # Result is 10
product = x * y       # Result is 50
quotient = x / y      # Result is 2.0

# To see the value, you use the print() function
print(sum_result)
Python's basic data types are also similar:
- Integer: Whole numbers, like
10. - Float: Numbers with decimal points, like
3.14. - String: Text, which can be wrapped in single or double quotes, like
'hello'or"world". - Boolean: Represents
TrueorFalse(note the capitalization).
The most common and versatile data structure in Python is the list. A list is an ordered collection of items, and unlike an R vector, it can hold items of different types. You create a list using square brackets [].
# Python

# A list of integers
ages = [25, 30, 22, 45]

# A list of strings
names = ["Alice", "Bob", "Charlie"]

# A mixed list
mixed_list = ["Alice", 30, True]
With these fundamentals, you're ready to start writing simple scripts and exploring data in both R and Python. The key is to practice these basic operations until they feel like second nature.
Time to check your understanding of these core concepts.
Which programming language was specifically designed by statisticians for statistical analysis and data visualization?
What is the correct way to assign the value 25 to a variable named my_age in R?
You've now taken the first step into the world of statistical programming. You have the tools installed and understand the basic grammar of R and Python. In the next section, we'll build on this foundation to see how we can import and work with real datasets.