Spreadsheet Filtering Techniques
Introduction to Spreadsheet Filters
Filtering Your Data
Spreadsheets are powerful tools for storing large amounts of information. But once you have all that data, how do you find what you’re looking for? Staring at hundreds of rows can be overwhelming. This is where filters come in.
Think of a filter like a sieve for your data. It lets you temporarily hide the rows you don't need to see, so you can focus only on the ones that meet specific criteria. This makes analyzing your information much more manageable. You can look at sales from just one region, view tasks assigned to a single person, or find all products below a certain price point.
Turning on Filters
Activating filters in most spreadsheet programs is straightforward. First, make sure your data is set up with a header row. These are the labels at the top of each column, like "Name," "Date," or "Amount."
Click on any single cell within your data set. Then, go to the "Data" tab in the menu ribbon and look for a button that says "Filter." It often looks like a funnel. Clicking it will add small dropdown arrows to each cell in your header row.
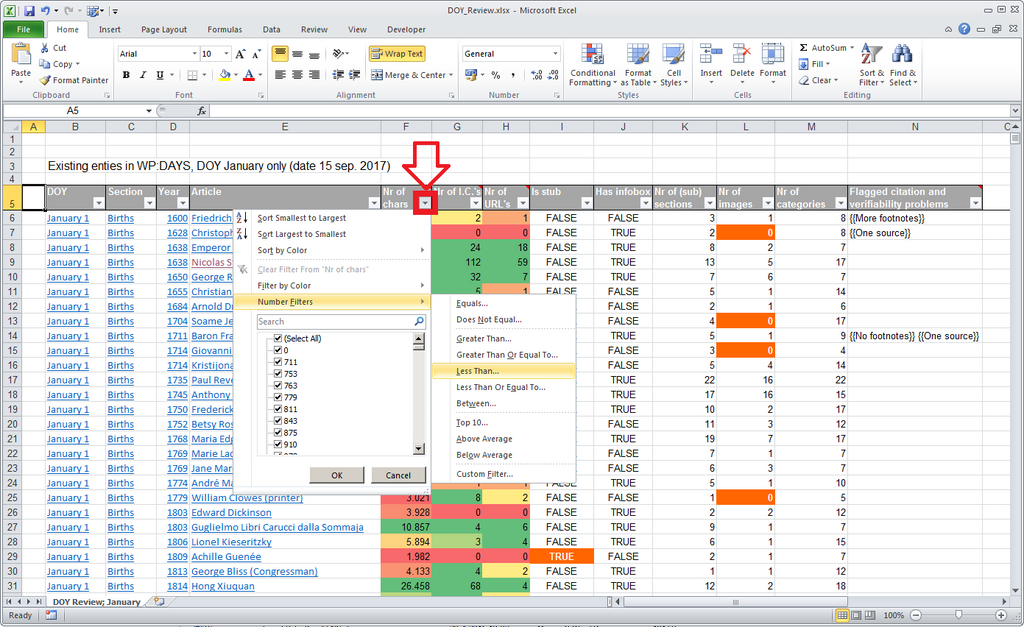
These little arrows are your control panel for filtering each column. A plain arrow means no filter is currently applied to that column. Once you apply a filter, the icon will often change to include a small funnel, letting you know at a glance which columns are actively filtering your data.
Applying a Basic Filter
Let's see how this works with a simple dataset. Imagine you have a list of recent orders.
| Order ID | Product | Region | Amount |
|---|---|---|---|
| 101 | Desk Chair | North | $150 |
| 102 | Keyboard | West | $75 |
| 103 | Monitor | North | $300 |
| 104 | Mouse | South | $25 |
| 105 | Desk Chair | West | $150 |
Suppose you want to see only the orders from the "North" region. You would click the dropdown arrow in the "Region" header. This opens a menu with a list of all the unique values in that column: North, West, and South.
By default, all are selected. To apply your filter, you would uncheck "(Select All)" and then check the box next to "North." When you click "OK," the table will instantly update, hiding all rows except for the two orders from the North region.
Filtering doesn't delete your data. It just temporarily hides the rows that don't match your criteria. You can always bring them back by clearing the filter.
To remove a filter and see all your data again, just click the funnel icon in the filtered column's header and choose the "Clear Filter" option. All your original rows will reappear.
Now, let's check your understanding of these concepts.
What is the primary purpose of using a filter in a spreadsheet?
What is a necessary prerequisite for activating filters on a dataset?
Filters are a fundamental tool for making sense of large datasets quickly and efficiently.