R Programming Fundamentals
Introduction to R
What is R?
R is a programming language designed specifically for statistical computing and graphics. Think of it as a powerful, free, and open-source calculator that can handle complex data analysis. It was created by statisticians, for statisticians, which makes it incredibly good at its job.
R has a strong focus on statistical analysis and visualization, with a vast number of statistical functions and high-quality plotting libraries.
Unlike a general-purpose language that can build a website or a mobile app, R's strength lies in its ability to explore datasets, run statistical tests, and create beautiful, informative visualizations. It's supported by a massive global community that contributes packages, or add-ons, that extend R's capabilities to nearly any field of data analysis you can imagine.
A Brief History
The story of R begins in the 1990s at the University of Auckland, New Zealand. Two statisticians, Ross Ihaka and Robert Gentleman, wanted a better tool for their teaching. They decided to create their own, naming it R, partly because both of their first names started with R.
R was heavily inspired by an older language called S, developed at Bell Labs in the 1970s. S was powerful but commercial. R was conceived as an open-source implementation of S, meaning anyone could use, modify, and share it for free. This open nature was key to its success. It grew from a small project into a global phenomenon, now maintained by a dedicated group of developers known as the "R Core Team" and fueled by contributions from thousands of users worldwide.
Core Features
So, what makes R so popular in the world of data? It comes down to a few key features.
First is its unparalleled collection of statistical tools. R has built-in functions for almost every statistical model or test you can think of, from simple t-tests to complex machine learning algorithms.
Second is its ecosystem of packages. The Comprehensive R Archive Network (CRAN) is a massive repository of over 19,000 free packages. Need to analyze genetic data? There's a package for that. Want to scrape data from the web? There's a package for that, too. This vast library means you rarely have to build a tool from scratch.
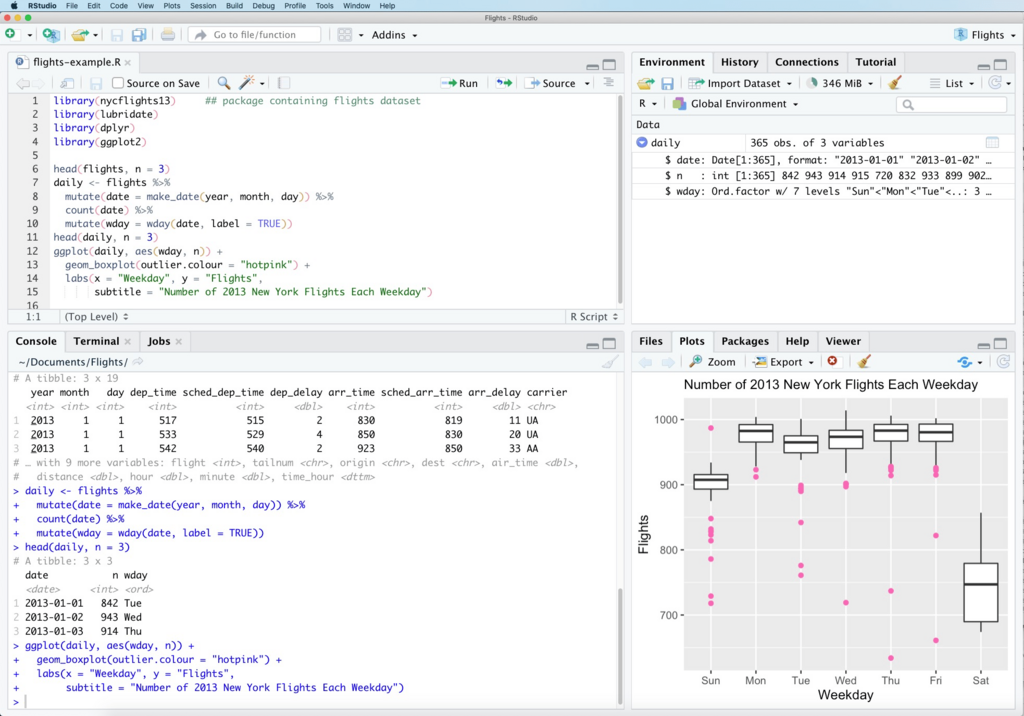
Finally, R excels at data visualization. Packages like ggplot2 allow you to create publication-quality graphs and charts with a clear and consistent grammar. This makes it easy to communicate your findings effectively.
R vs. Other Languages
When people talk about data analysis, the conversation often turns to R versus Python. Both are powerful, free, and have large communities. But they have different strengths.
| Feature | R | Python |
|---|---|---|
| Primary Use | Statistical analysis and data visualization | General-purpose programming, web development, machine learning |
| Strengths | Exploratory data analysis, academic research, specialized statistics | Building models into production applications, data engineering, deep learning |
| Learning Curve | Can be steep for those without a stats background | Generally considered easier for programming beginners |
| Libraries | CRAN for statistics; ggplot2 for plotting | Pandas for data manipulation; Scikit-learn for machine learning |
The choice isn't always one or the other. Many data scientists are proficient in both, using R for initial exploration and statistical modeling, and then switching to Python to integrate those models into larger applications. The best tool often depends on the specific problem you're trying to solve.
What is the primary purpose for which the R programming language was designed?
The central repository that hosts over 19,000 free, add-on packages for R is known as...