R Programming Fundamentals
Introduction to R
What Is R?
R is a programming language designed specifically for statistical computing and graphics. Think of it as a specialized tool created by statisticians, for statisticians. It's the language many researchers and data scientists turn to when they need to explore data, run statistical models, and create insightful visualizations.
Its story begins in the 1990s with two professors in New Zealand, Ross Ihaka and Robert Gentleman. They wanted a better tool for their statistics classes and decided to create their own, inspired by an older language called S. They named it R, partly after their first names and partly as a play on the name S. What started as a small project has grown into a global standard for data analysis, thanks to a large and active open-source community.
R is an open-source programming language that is widely used as a statistical software and data analysis tool.
Why R Stands Out
So, what makes R special? It has a few core strengths that set it apart.
First, it's a statistical powerhouse. R comes with a massive library of built-in statistical functions, from simple descriptive statistics to complex machine learning models. If a new statistical method is published, it’s likely to appear as an R package first.
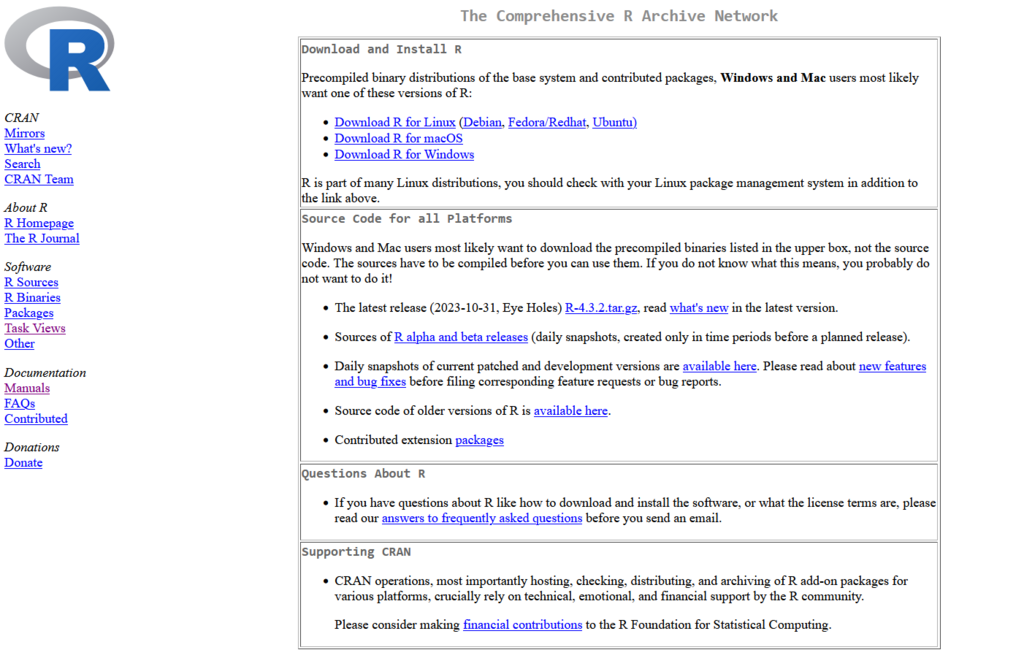
This brings us to its second major feature: packages. The R ecosystem is supported by the Comprehensive R Archive Network (CRAN), which hosts thousands of free, user-contributed packages. These are like add-ons that extend R's capabilities for specific tasks, whether it's analyzing financial data, mapping geographic information, or parsing text. It's like an app store for data analysis.
R is also renowned for its high-quality graphics. Using packages like ggplot2, you can create anything from simple bar charts to intricate, multi-layered visualizations. The level of customization is immense, allowing you to tailor plots to tell a clear and compelling story with your data.
R in the Real World
R isn't just an academic tool; it's used across many industries. Scientists use it to analyze experimental data, financial analysts use it to model stock prices, and marketers use it to understand customer behavior. Companies like Google, Facebook, and Microsoft all use R to make sense of their massive datasets.
From genetics to finance, R provides the tools to uncover insights hidden in data. Its flexibility makes it a go-to choice for solving complex, data-rich problems.
It’s also a cornerstone of reproducible research. With tools like R Markdown, analysts can create documents that weave together their code, the results, and their written explanations. This creates a transparent and verifiable workflow, which is critical in both science and business.
R vs. Other Languages
When people talk about data analysis, Python is often mentioned in the same breath as R. While both are powerful, they have different philosophies.
| Feature | R | Python |
|---|---|---|
| Primary Use | Statistical analysis and data visualization | General-purpose programming, including data science |
| Strengths | Deep statistical libraries, superior graphics | Versatility, web integration, machine learning |
| Learning Curve | Can be quirky for programmers from other backgrounds | Generally considered easier for beginners to learn |
| Community | Strong in academia and research | Very large and diverse across many domains |
Essentially, R is a specialist. It was built from the ground up for data work. Python is a generalist; it can do almost anything, including data analysis, but it relies on add-on libraries like pandas and matplotlib to do so. The choice between them often comes down to the specific task or the background of the user. A statistician might prefer R's environment, while a software engineer might feel more at home with Python.
Compared to tools like Excel or SPSS, R offers far more power, flexibility, and reproducibility. While those tools are great for simpler tasks, R's scripting capabilities allow you to automate complex workflows and handle much larger datasets.
Let's check your understanding of these core concepts.
What is the primary function of the Comprehensive R Archive Network (CRAN)?
How is R's philosophy generally described in comparison to Python's for data analysis?
R offers a powerful and expressive way to work with data. Its strong foundation in statistics and its vibrant community make it an essential tool for anyone serious about data analysis.