Percentage Points vs Percentages in Regression
Linear Regression Basics
Finding Relationships in Data
How do you predict one thing based on another? For example, if you know the temperature outside, can you predict how many ice cream cones a shop might sell? Linear regression is a statistical tool that helps answer questions like this. It models the relationship between two variables by fitting a straight line to the data.
In our example, temperature is the independent variable (also called the predictor variable). It's the one we think influences the other. Ice cream sales are the dependent variable (or response variable), because we think its value depends on the temperature. Linear regression helps us understand how, and how much, the independent variable can be used to predict the dependent variable.
Linear regression analysis is used to predict the value of a variable based on the value of another variable.
The Line of Best Fit
When we plot our data points on a graph, like temperature versus ice cream sales, they probably won't form a perfect line. They'll be scattered. The goal of linear regression is to draw a single straight line through these points that best represents the overall trend. This is called the "line of best fit."
This line acts as a simple summary of the relationship. It doesn't have to pass through every point, but it should be as close to all of them as possible.
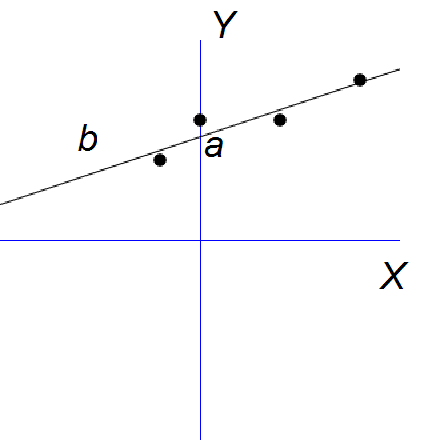
This line isn't just a visual guide; it's a mathematical equation. With this equation, we can plug in a value for our independent variable (like a specific temperature) and get a prediction for our dependent variable (ice cream sales).
The Regression Equation
Every straight line can be described by a simple equation. In statistics, we often write it this way:
Let's break down what each part means:
- is the dependent variable (what we want to predict).
- is the independent variable (what we're using to predict).
- is the intercept.
- is the slope.
The slope and the intercept are the two key numbers that define our specific line. Once we find the best values for and , we have our predictive model.
Interpreting the Pieces
Understanding the intercept and slope is crucial for making sense of the model.
The intercept (a) is the predicted value of when is zero. It's the point where the regression line crosses the vertical y-axis.
In our ice cream example, the intercept would be the predicted number of sales when the temperature is 0 degrees. Sometimes the intercept isn't practically meaningful. For instance, if you're predicting a person's weight based on their height, a height of zero is impossible, so the intercept is just a mathematical anchor for the line.
The slope (b) tells us how much we expect to change when increases by one unit. It describes both the direction and the steepness of the line.
A positive slope means that as increases, tends to increase. For example, a slope of 3 for our ice cream data would mean that for every 1-degree increase in temperature, we predict the shop will sell 3 more ice cream cones.
A negative slope means that as increases, tends to decrease. If we were modeling the relationship between hours of TV watched and test scores, we might find a negative slope. A slope of zero means there is no linear relationship between the variables.
Time to test your knowledge.
What is the primary goal of simple linear regression?
A researcher is studying the relationship between the number of hours a student studies and their final exam score. What is the independent variable?