Mastering Regression Analysis from Basics to Expert
Linear Regression
Modeling Relationships with Lines
Often, we want to understand how two things are related. For example, does more rainfall lead to taller trees? If a student studies more hours, will their exam score be higher? Linear regression helps us answer these kinds of questions by modeling the relationship with a straight line.
We start with two variables. The one we want to predict is called the dependent variable (like the exam score). The one we use to make the prediction is the independent variable (like study hours). Linear regression draws the best possible straight line through a scatter plot of our data points to describe this relationship.
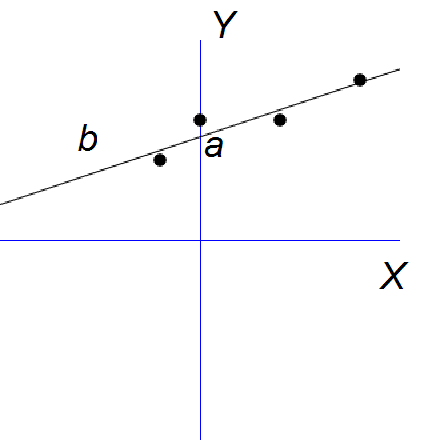
The goal is to find an equation for this line that we can use to make predictions. If we know a student studied for 6 hours, we can use the line to estimate their likely exam score.
The Regression Equation
The relationship is captured in a simple equation. This formula defines the line that best represents the connection between our independent variable, , and our dependent variable, .
Let's break down the two main parts, called coefficients:
-
Intercept (): This is the predicted value of when is zero. In our study example, it would be the predicted exam score for a student who studied for zero hours.
-
Slope (): This is the most important part. It tells us how much we expect to change when increases by one unit. If is 2.5, it means that for every additional hour of studying, we predict the exam score will increase by 2.5 points.
A positive slope means as increases, tends to increase. A negative slope means as increases, tends to decrease.
Finding the Best Fit
There are many possible lines we could draw through a set of data points. How does the model choose the best one? It uses a method called Ordinary Least Squares (OLS).
For any given line, we can measure the vertical distance from each data point to the line. This distance is called a residual. It's the error in our prediction for that specific data point.
residual
noun
The difference between the observed value of the dependent variable and the value predicted by the regression line.
Some residuals will be positive (the point is above the line) and some will be negative (the point is below the line).
To find the best line, OLS squares each residual—which makes them all positive and penalizes larger errors more—and then adds them all up. The line that results in the smallest possible sum of these squared residuals is our winner. It's the line of "best fit."
Is the Model Any Good?
Once we have our best-fit line, we need to assess how well it actually explains the data. A common metric for this is the R-squared value, also known as the coefficient of determination.
tells us the percentage of the variation in our dependent variable that can be explained by our independent variable. An of 0.75 means that 75% of the variation in exam scores can be explained by the hours spent studying.
A higher generally means a better fit, but what's considered "good" depends on the field. In physics, you might expect very high values, while in social sciences, where human behavior is complex, a lower might still be very meaningful.
Another way to assess a model is to look at the p-values for the coefficients. A p-value tells you the probability of observing your results if there were actually no relationship between the variables. A small p-value (typically less than 0.05) suggests that your independent variable is a statistically significant predictor of the dependent variable.
Time to test your knowledge.
In a linear regression model designed to predict a person's weight based on their height, what is the 'dependent variable'?
A linear regression model is built to predict monthly sales based on advertising spending. The slope coefficient (β₁) is 4.5. What is the correct interpretation of this value?
Linear regression is a powerful, fundamental tool. It's the starting point for many kinds of statistical analysis and machine learning.