Mastering Postman for API Development
Postman Interface Essentials
The Postman Workspace
Opening Postman for the first time can feel like stepping into the cockpit of a complex machine. There are panels, buttons, and tabs everywhere. Let's break down the layout into three main areas: the Sidebar on the left, the Request Builder in the centre, and the Response Viewer at the bottom.
Think of the sidebar as your filing cabinet. This is where you organise your work into Collections, manage different testing setups with Environments, and look back at previous requests in your History. The main area is your workbench, where you actively build and send API requests.
Keep your sidebar tidy. A well-organised collection saves hours of searching for that one specific request you made last Tuesday.
The sidebar itself has a few key views. On the far left, you'll see icons for Collections, Environments, History, and more. Clicking each one changes the content of the main sidebar panel. For now, we'll focus on these three, as they form the backbone of a typical workflow.
Building and Sending Requests
The heart of Postman is the request builder. This is where you tell the API what you want to do. At the top, you'll find the most important controls: the HTTP method dropdown (GET, POST, PUT, etc.), the request URL input field, and the big blue "Send" button.
Just below the URL field is a set of tabs that help you refine your request. You can add URL parameters in the "Params" tab, handle authentication in the "Authorization" tab, add custom HTTP headers in "Headers", and provide data for POST or PUT requests in the "Body" tab. When you fill in the "Params" tab, Postman automatically appends them to the URL above, which is a handy way to avoid typos in a long query string.
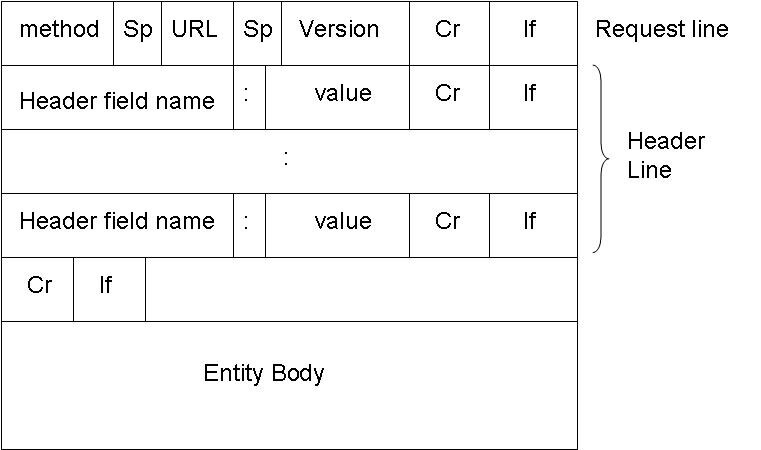
For the "Body" tab, you'll most often use the raw option with the type set to JSON for modern APIs. This is where you'll write the data payload your API endpoint is expecting.
Inspecting the Response
After you click "Send", the bottom half of the screen comes to life. This is the Response Viewer. The first thing to check is the Status Code on the right. A 200 OK means success, while codes in the 400s (like 404 Not Found or 401 Unauthorized) indicate a client-side error, and 500s mean something went wrong on the server.
The Response Viewer also has tabs. The "Body" tab shows the actual data returned by the API, usually in JSON format. Postman automatically formats it to be readable. The "Headers" tab lists all the HTTP headers the server sent back, which is invaluable for debugging issues related to caching or content types. You can also view any cookies the server set.
Finally, don't forget the History tab in the main sidebar. Every request you send is automatically saved there. This is a lifesaver when you're experimenting and accidentally close an unsaved tab. You can find the request in your history, reopen it, and save it to a Collection for future use.
What are the three main areas of the Postman user interface?
You need to send a JSON payload with a POST request. In which tab of the Request Builder would you add this data?
Getting comfortable with this request-response loop inside the Postman interface is the first major step. It turns abstract API concepts into a tangible workflow you can see and control.