Mastering Modern Web Developer Tools
DOM and CSS Debugging
Visual Layout Editing
Modern CSS layouts with Flexbox and Grid can feel like a black box. You write the code, refresh the page, and hope for the best. When something is off by a few pixels or a container doesn't align as expected, finding the root cause can be frustrating. Browser developer tools offer a powerful visual way to debug these layouts directly on the page.
In the Elements panel, next to any element that has display: flex or display: grid applied, you'll see small badges labeled flex or grid. Clicking these badges toggles a visual overlay on the page, showing you the exact boundaries of your layout, including tracks, lines, and gaps. This is your first step to understanding how the browser is interpreting your code.
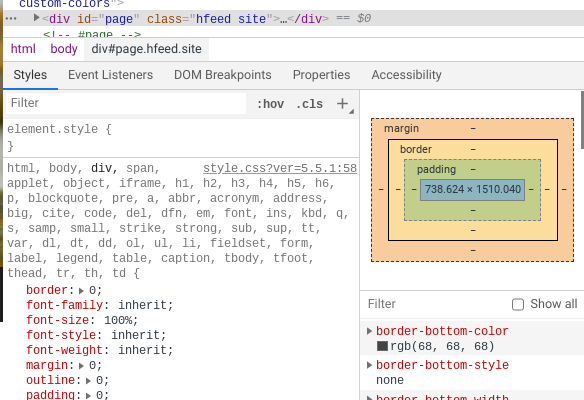
For even more control, look for the "Layout" tab in the same pane where you find "Styles" and "Computed". This dedicated pane provides interactive controls for the layout you've selected. For a container, you can click icons to change flex-direction, justify-content, and align-items. For a Grid layout, you can toggle line numbers and area names. These changes are reflected on the page in real time, turning frustrating guesswork into an interactive design session.
Pinpointing Dynamic Changes
Websites aren't static. JavaScript constantly adds, removes, and changes elements in response to user actions or data fetching. When an element appears or a class name changes unexpectedly, how do you find the exact line of code responsible? This is where come in handy.
You can set these breakpoints by right-clicking an element in the Elements panel. In the context menu, under "Break on...", you'll find three options:
- Subtree modifications: Pauses execution when any child element is added, removed, or moved. This is perfect for debugging things like pop-up modals or dynamically loaded lists.
- Attribute modifications: Triggers when an attribute on the selected element changes. Use this to catch scripts that toggle classes (like
.is-visible) or change inline styles. - Node removal: Pauses just before the selected node is removed from the DOM. This is useful for figuring out why an element is disappearing.
When a DOM breakpoint is hit, the debugger will take you directly to the line in the Sources panel that caused the change, revealing the responsible script.
Debugging States and Styles
Some of the most important styles on a site only apply during specific user interactions, like hovering over a button or focusing on an input field. Debugging these :hover, :active, :focus, or :visited styles is tricky because they disappear as soon as you move your mouse to inspect them. DevTools provides a way to lock an element into one of these states.
In the "Styles" pane, look for a button that often looks like :hov. Clicking it reveals a checklist of pseudo-classes you can force onto the selected element. Check the box for :hover, and the element will be styled as if your mouse is permanently over it, allowing you to inspect and tweak its hover styles with ease.
But what about when a style isn't applying at all? The "Computed" tab is your best friend for resolving CSS specificity issues. It shows the final, calculated CSS properties for the selected element. You can expand a property like color to see every single CSS rule that tried to set it, with the winning rule at the top. The rules that were overridden are shown crossed out, telling you exactly which selector was more specific.
Finding Attached Events
Sometimes the problem isn't the styles, but the interactivity. If clicking a button doesn't do what you expect, you need to find the attached to it. While you could search your entire codebase for addEventListener, DevTools offers a more direct route.
Select an element in the Elements panel, then look for the "Event Listeners" tab. This pane lists every event listener attached to that element, grouped by event type (e.g., click, mousedown, focus). You can expand each event to see the function that will be executed. Clicking the filename next to the function definition will take you directly to that spot in the Sources panel. You can even remove listeners temporarily by unchecking them to see how your page behaves without them.
Tip: Learn to inspect elements in your browser’s dev tools to see how HTML and CSS are used on live websites.
With these advanced techniques, the developer tools become more than just an inspector; they become an interactive environment for debugging, designing, and understanding the complex interplay between your HTML, CSS, and JavaScript.
Ready to test your knowledge?
In the Elements panel, how can you toggle a visual overlay to debug a display: grid or display: flex container directly on the page?
You notice a modal pop-up is being unexpectedly added to the <body> of your page. Which DOM change breakpoint would be most effective for pausing the script right when this happens?