Mastering Grafana Dashboards
Introduction to Grafana
What is Grafana?
At its heart, Grafana is a tool for seeing and understanding data. Think of it as a powerful, interactive magnifying glass for the numbers and logs that pour out of modern software and hardware. It takes raw data—from your website's traffic, a server's memory usage, or even your home's temperature sensors—and turns it into insightful visuals.
Grafana is often called an observability platform. That just means it helps you understand a system's internal state by looking at its external outputs. Instead of guessing why an application is slow, you can use Grafana to see exactly what's happening with its performance metrics, logs, and traces, all in one place.
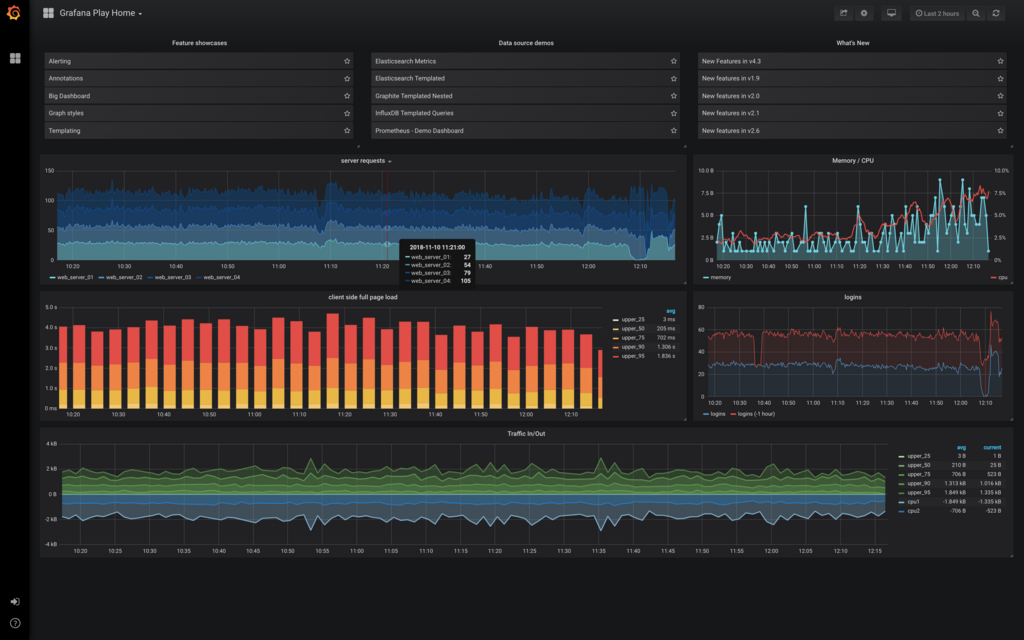
See Your Data in Action
Grafana’s primary job is data visualization. It transforms streams of numbers and text into charts, graphs, and heatmaps that are easy to digest. This is crucial because spotting a spike in a line graph is much faster than finding an problematic number in a massive spreadsheet.
These visualizations are organized into dashboards. A dashboard is a collection of individual panels, each displaying a specific piece of information. You can customize your dashboards to tell a story about your system's health, track business goals, or monitor application performance. It’s your single source of truth, giving you a complete overview at a glance.
A good dashboard answers important questions quickly, without needing to dig through raw data.
But Grafana isn't just for looking at data. It can also watch it for you. The alerting feature lets you define rules for your metrics. If CPU usage spikes above 90% or website errors exceed a certain rate, Grafana can automatically send a notification. This lets your team know about problems the moment they happen, so they can act on them immediately.
Connect to Anything
Grafana's real power comes from its flexibility. It doesn't store your data itself. Instead, it connects to the places where your data already lives. These are called data sources.
Grafana works great with InfluxDB for storing IoT devices metrics, and it also supports other data sources (Prometheus, MySQL, Postgres)
It supports a huge variety of data sources out of the box. Whether your data is in a time-series database like Prometheus or InfluxDB, a relational database like MySQL or PostgreSQL, or even a simple Google Sheet, Grafana can probably connect to it. This means you don't have to move your data to use Grafana; it meets your data where it is.
This ability to pull data from multiple systems into a single dashboard is a game-changer. You can have one graph showing application performance from Prometheus right next to another showing business metrics from a SQL database. This provides a holistic view that is difficult to achieve otherwise.
How It Works
Grafana's architecture is straightforward. It consists of two main parts: a back-end and a front-end.
The back-end server is the engine. Written in the Go programming language, it's responsible for querying data sources, processing alerts, and handling user authentication. When you ask to see a dashboard, the back-end sends requests to the appropriate data sources, collects the results, and passes them along.
The front-end is what you see and interact with in your web browser. It’s a modern web application that takes the data from the back-end and renders the beautiful dashboards and graphs Grafana is known for. This separation allows Grafana to be fast and responsive, even when dealing with large amounts of data.
What is the primary function of Grafana?
In Grafana, a collection of individual visualization panels organized to provide an overview of a system is called a...
By visualizing data from virtually any source, Grafana gives teams the insight they need to keep complex systems running smoothly.