Mastering DBSCAN Clustering
Introduction to Clustering
Finding Groups in Data
Imagine you have a large collection of customer data. Some customers behave similarly, buying certain products or visiting your site at specific times. How could you find these natural groupings without manually sifting through everything? This is where clustering comes in.
Clustering is a type of unsupervised learning, meaning you don't need pre-labeled data to start. The goal is to partition a dataset into groups, or clusters, where the items within a cluster are more similar to each other than to those in other clusters. It's a fundamental technique for exploratory data analysis, helping to reveal hidden patterns and structures.
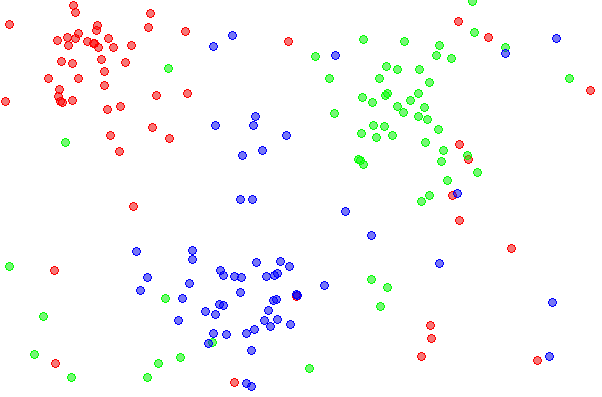
The power of clustering lies in its ability to make sense of complexity. By grouping data points, we can understand population segments, identify anomalies, and organize information more effectively. But there's no single way to create these groups. Different algorithms approach the problem with different assumptions about what constitutes a cluster.
Three Main Approaches
Clustering methods are broadly categorized based on how they form groups. Let's look at three of the most common families: partitioning, hierarchical, and density-based.
Partitioning methods divide the dataset into a predetermined number of non-overlapping clusters. The most famous example is K-Means. You tell the algorithm how many clusters () to find, and it iteratively assigns each data point to the nearest cluster center, or centroid. It's fast and works well for spherical, evenly-sized clusters. However, you need to know the number of clusters in advance, and it struggles with groups that are oddly shaped or have varying sizes.
Here is a simple visualization of how K-Means might find two clusters. The algorithm starts with random centroids (stars), assigns points to the nearest one, and then moves the centroids to the center of their newly assigned points, repeating until the assignments stabilize.
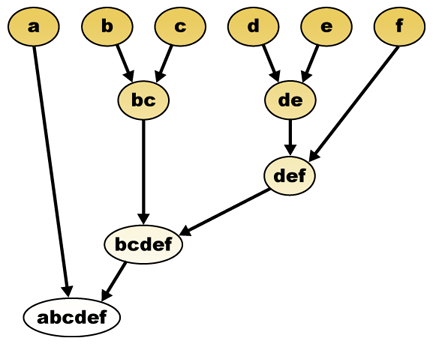
Hierarchical methods create a tree of clusters. There are two main strategies: agglomerative (bottom-up) and divisive (top-down). In the more common agglomerative approach, each data point starts in its own cluster. Then, the two closest clusters are repeatedly merged until only one cluster remains. This entire process is visualized using a tree-like diagram called a dendrogram, which you can cut at different heights to get different numbers of clusters. This method is valuable because it doesn't require you to specify the number of clusters beforehand.
Density-based methods connect areas of high data point concentration into clusters. This allows them to find arbitrarily shaped clusters and also identify points in low-density regions as outliers, or noise. An algorithm like DBSCAN (Density-Based Spatial Clustering of Applications with Noise) doesn't require a set number of clusters. Instead, it defines clusters as continuous regions of high density, which makes it excellent for datasets that don't have simple, spherical groupings.
Clustering in the Real World
The applications of clustering are vast and cross many industries. The choice of technique depends on the problem you're trying to solve and the nature of your data.
| Industry | Application | Common Technique |
|---|---|---|
| Marketing | Segmenting customers based on purchasing behavior to create targeted campaigns. | Partitioning (K-Means) |
| Biology | Grouping genes with similar expression patterns to identify functional relationships. | Hierarchical |
| Finance | Identifying fraudulent transactions by flagging them as anomalies or outliers. | Density-Based (DBSCAN) |
| Urban Planning | Grouping areas with similar crime patterns to allocate police resources effectively. | Density-Based |
| Image Processing | Segmenting images into regions of similar color or texture for object recognition. | Partitioning (K-Means) |
Each of these methods offers a different lens through which to view your data. Understanding their core ideas is the first step toward uncovering the hidden stories your dataset holds.
What is the primary goal of clustering?
Which clustering method creates a tree-like diagram, known as a dendrogram, to represent the groupings?