Linear Regression Explained
Introduction to Linear Regression
Finding the Pattern
Linear regression is a way to find a straight-line relationship between two things. Imagine you're selling ice cream. You probably sell more on hot days than on cold ones. Linear regression helps you figure out exactly how much more you might sell as the temperature rises.
It takes a bunch of data points, like daily temperature and daily sales, and draws the best possible straight line through them. This line represents the simplest relationship between the two variables.
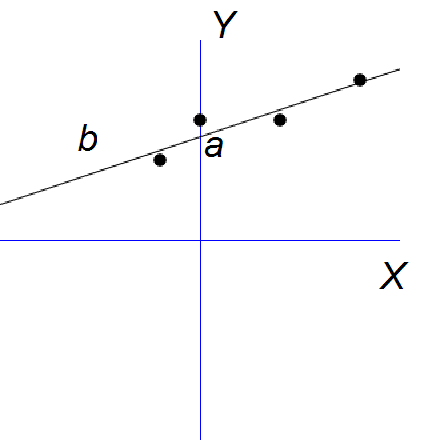
The main goal is to model a relationship so we can make predictions. If we know the temperature tomorrow, we can use our line to estimate how much ice cream we'll sell. It's a fundamental tool for forecasting and understanding how one variable affects another.
Linear regression analysis is used to predict the value of a variable based on the value of another variable.
Real-World Uses
You can find linear regression at work in many different fields.
In business, a company might use it to predict product sales based on its advertising budget. How much do sales increase for every extra $1,000 spent on ads?
In finance, an investor could model the relationship between a company's stock price and the overall market's performance.
In healthcare, a doctor might use a patient's weight to predict their blood pressure. The applications are everywhere because simple, linear relationships are surprisingly common.
The Math Behind the Line
The straight line at the heart of linear regression comes from a familiar formula from algebra.

Statisticians write the formula with slightly different notation. The model tries to predict a dependent variable (often called ) using an independent variable (). The relationship is defined by two parameters: the intercept and the slope.
Let's break that down:
- is the variable we are trying to predict (e.g., ice cream sales).
- is the variable we are using to make the prediction (e.g., temperature).
- is the slope. It tells us how much is expected to increase when goes up by one unit.
- is the intercept. It's the predicted value of when is zero.
- (epsilon) is the error term. It represents the part of that our model can't explain. Real-world data is never perfectly clean, so this term accounts for the random noise or variation that our line doesn't capture.
The goal of linear regression is to find the values for the intercept () and the slope () that create the best-fitting line for the data.
By finding these values, we can plug in any new value and get a prediction for . This simple but powerful idea is a cornerstone of statistics and data analysis.