Linear Regression Essentials
Introduction to Linear Regression
Finding the Pattern
Linear regression is a way to find a simple relationship between two things. Imagine you're selling ice cream. You probably notice that you sell more on hot days. Linear regression helps you figure out exactly how much more ice cream you can expect to sell for every degree the temperature rises. It's a fundamental tool for making predictions based on data.
In this process, we work with two types of variables.
Dependent Variable
noun
The main thing you are trying to predict or explain. In our example, this is the amount of ice cream sold.
Independent Variable
noun
The factor you believe has an impact on your dependent variable. In our example, this is the daily temperature.
The goal of linear regression is to model the relationship between the independent variable (the cause) and the dependent variable (the effect).
This idea pops up everywhere. A company might use it to predict its sales based on its advertising budget. A doctor could use it to estimate a patient's blood pressure based on their weight. An ecologist might model the population of a certain bird species based on annual rainfall.
The Math Behind the Line
At its heart, linear regression tries to draw a straight line through your data points that best represents the overall trend. The formula for this line will look familiar if you've ever studied algebra.
Let's break that down:
- is our dependent variable (ice cream sales).
- is our independent variable (the temperature).
- is the intercept. This is where the line crosses the vertical y-axis. It's the value of when is zero.
- is the slope, or the coefficient for our independent variable. This tells us how much changes for every one-unit increase in .
- (epsilon) is the error term. It represents the part of that our model can't explain. Not every data point will fall perfectly on the line, and this term accounts for that random variation.
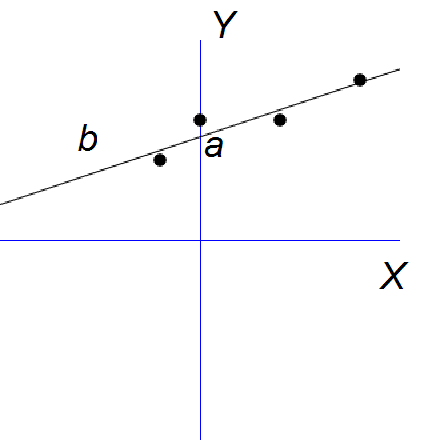
The main task of linear regression is to find the best possible values for the intercept () and the slope () that make the line fit the data as closely as possible.
A Simple Example
Let's return to our ice cream shop. Suppose we collect data for a week:
| Day | Temperature (°C) (X) | Sales (Units) (Y) |
|---|---|---|
| Monday | 20 | 105 |
| Tuesday | 22 | 115 |
| Wednesday | 25 | 130 |
| Thursday | 28 | 142 |
| Friday | 30 | 155 |
If we plotted these points on a graph, we'd see they almost form a straight line. Linear regression would find the one specific line that best captures this trend. For instance, the model might produce an equation like:
Sales = 5 + 5 * Temperature
This would mean that for every 1-degree increase in temperature, we can predict an increase of 5 ice cream unit sales. The model starts with a baseline of 5 sales even at 0 degrees, which is our intercept.
This simple model gives us a powerful tool. If the forecast for tomorrow is 26°C, we can plug that into our formula to predict our sales. It's a foundational concept that paves the way for much more complex and powerful predictive models.