Geospatial Data Analytics Essentials
Introduction to Geospatial Data
What is Geospatial Data?
Geospatial data is simply information that is tied to a specific location on Earth. Think about the weather app on your phone. It doesn't just tell you the temperature; it tells you the temperature right where you are. That's geospatial data at work. It answers the fundamental question: "Where?"
This type of data is crucial in many fields. It helps urban planners decide where to build new parks, allows farmers to monitor crop health from above, and enables navigation apps to guide you through traffic. Any time you need to understand patterns, relationships, or trends related to geography, you're using geospatial data.
Every piece of geospatial data has two key parts: spatial data and attribute data.
Spatial data is the location information. It can be a specific coordinate like latitude and longitude, an address, or a boundary. It's the "geo" part of geospatial.
Attribute data is the descriptive information. It tells you what is at that location. For a coffee shop, the spatial data is its address, while the attribute data could be its name, hours, and customer rating. For a park, the spatial data is its boundary, and the attribute data might include its size in acres and whether it has a playground.
Two Flavors of Data
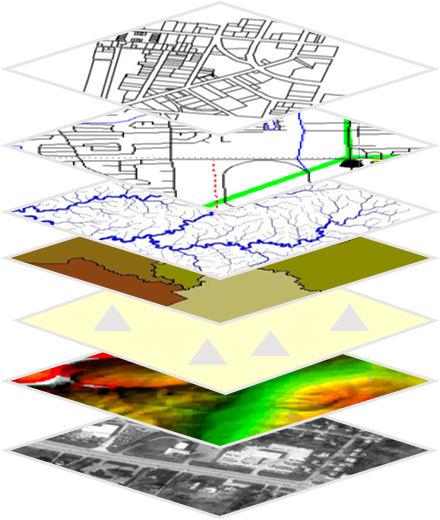
Geospatial data generally comes in two main types: vector and raster. They represent the world in fundamentally different ways, and each has its strengths.
Vector
noun
A data model that uses points, lines, and polygons to represent discrete, real-world features.
Vector data is perfect for representing things with clear, defined boundaries.
- Points are single locations, like a fire hydrant, a specific tree, or a city on a world map.
- Lines (or polylines) represent linear features, such as roads, rivers, or subway routes.
- Polygons are closed shapes that represent areas, like country borders, park boundaries, or building footprints.
The other main type is raster data. Instead of using points and lines, raster data represents the world as a grid of cells, or pixels. Each cell in the grid has a specific value.
Raster
noun
A data model that uses a grid of cells (pixels) to represent continuous phenomena, where each cell contains a value.
Raster data is ideal for representing information that changes continuously across a landscape, like temperature, elevation, or satellite imagery. A photograph of the Earth from space is a classic example of raster data. Each pixel has a value corresponding to a color, which together form an image.
Here's a quick comparison:
| Feature | Vector Data | Raster Data |
|---|---|---|
| Structure | Points, lines, polygons | Grid of cells (pixels) |
| Best For | Discrete features (roads, buildings) | Continuous phenomena (elevation, temperature) |
| Examples | A map of country borders | A satellite photograph |
| Precision | High, defined by coordinates | Limited by pixel size |
Formats and Sources
Just like you have .jpg for photos and .mp3 for music, geospatial data has its own file formats. You'll often encounter these three:
- Shapefile (.shp): A very common and older format for vector data. A shapefile isn't a single file, but a collection of files that work together.
- GeoJSON (.json or .geojson): A modern, lightweight format based on JavaScript Object Notation. It's popular for web-based mapping applications.
- KML (Keyhole Markup Language): This is the format used by Google Earth. It's great for visualizing data on Google's platform.
So where does all this data come from? There are many sources, but here are some of the most important:
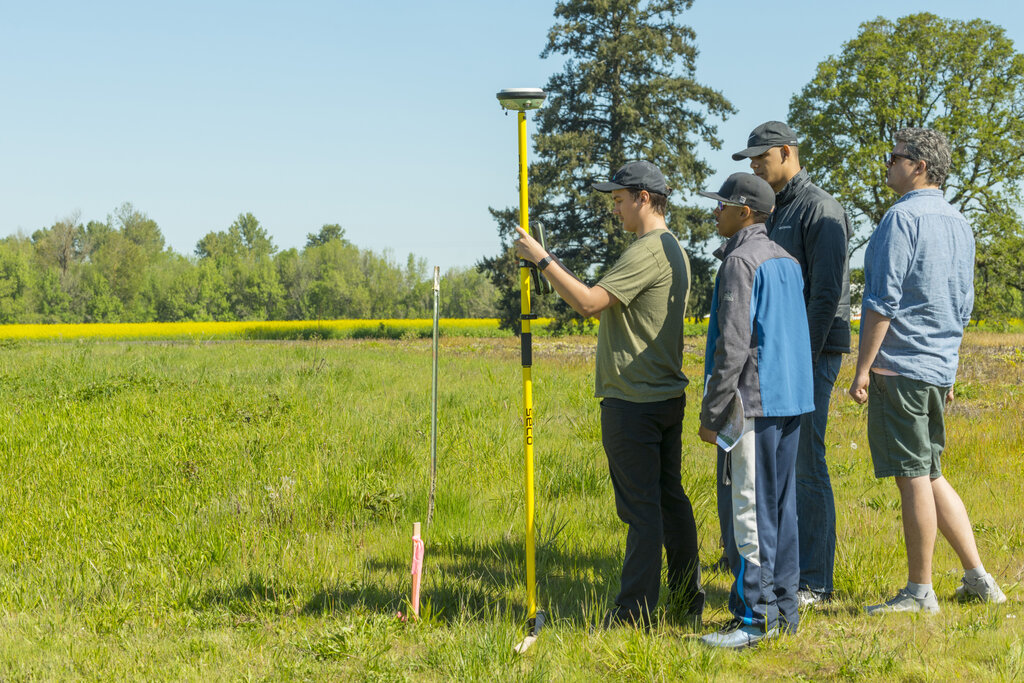
Common sources include satellite imagery, GPS measurements, and on-the-ground surveys.
Satellites constantly orbit the Earth, capturing images that become raster data. The Global Positioning System (GPS) uses signals from a network of satellites to pinpoint exact locations on the ground, providing highly accurate point data. Finally, traditional land surveys involve professionals using specialized equipment to measure and map features, a practice that remains essential for creating precise vector data for engineering and property management.
Let's review these core concepts.
Now, check your understanding with a few questions.
Geospatial data combines which two fundamental types of information?
An urban planner wants to map the exact boundaries of all city parks. Which data type is most suitable for this task?
Understanding these basics—what geospatial data is, its different types, and where it comes from—is the first step toward using it to analyze and understand the world around us.