Decoding Health News and Stats
Understanding Medical Statistics
Making Sense of Health Data
When you read about a new drug or a health study, you're often hit with a wall of numbers and terms. How do we know if a treatment is truly effective? How do doctors make informed decisions? The answer lies in medical statistics, the science of collecting, analyzing, and interpreting health data.
Before we can analyze data, we need to understand what kind of information we're working with. Data comes in a few different flavors.
| Data Type | Description | Medical Example |
|---|---|---|
| Nominal | Categories with no order. | Blood types (A, B, AB, O) |
| Ordinal | Categories with a clear order but no set distance between them. | Pain scale (mild, moderate, severe) |
| Interval | Ordered data with equal intervals, but no true zero. | Body temperature in Celsius or Fahrenheit |
| Ratio | Ordered data with equal intervals and a true zero. | Heart rate, height, weight |
Recognizing these types is the first step. It determines which statistical tools we can use to make sense of the information.
Finding the Center
One of the first things we want to know about a set of data is its “center.” What’s a typical value? We have three main ways to measure this, known as measures of central tendency.
Mean
noun
The average of all numbers in a dataset. You find it by adding up all the values and dividing by the count of values.
The mean is useful, but it can be misleading if there are outliers, or extremely high or low values. Imagine calculating the average recovery time, but one patient took 100 days to recover while everyone else took about a week. That one patient would pull the mean much higher.
In cases like that, the median is often a better measure.
Median
noun
The middle number in a sorted list of data. Half the values are above it, and half are below.
Finally, we have the mode.
Mode
noun
The value that appears most often in a dataset.
The mode is most useful for categorical data, like blood types, where you can't calculate a mean or median.
Measuring the Spread
Knowing the center isn't enough. We also need to understand how spread out the data is. Are all the values clustered tightly around the mean, or are they all over the place?
Imagine two groups of patients testing a new blood pressure drug. Both groups have the same mean drop in blood pressure. But in Group A, everyone's blood pressure dropped by about the same amount. In Group B, some patients had a huge drop while others had almost none. The drug is more reliable for Group A, and this is where standard deviation comes in.
Standard deviation is a measure of how dispersed the data is in relation to the mean. A low standard deviation means the data points are clustered close to the mean, while a high standard deviation indicates they are spread out over a wider range.
It's calculated using a related concept called variance. Variance is the average of the squared differences from the mean. Because it involves squaring, its units aren't very intuitive. So, we take its square root to get the standard deviation, which brings it back to the original units of measurement.
For data that follows a normal distribution (a symmetrical, bell-shaped curve), the standard deviation is particularly powerful.
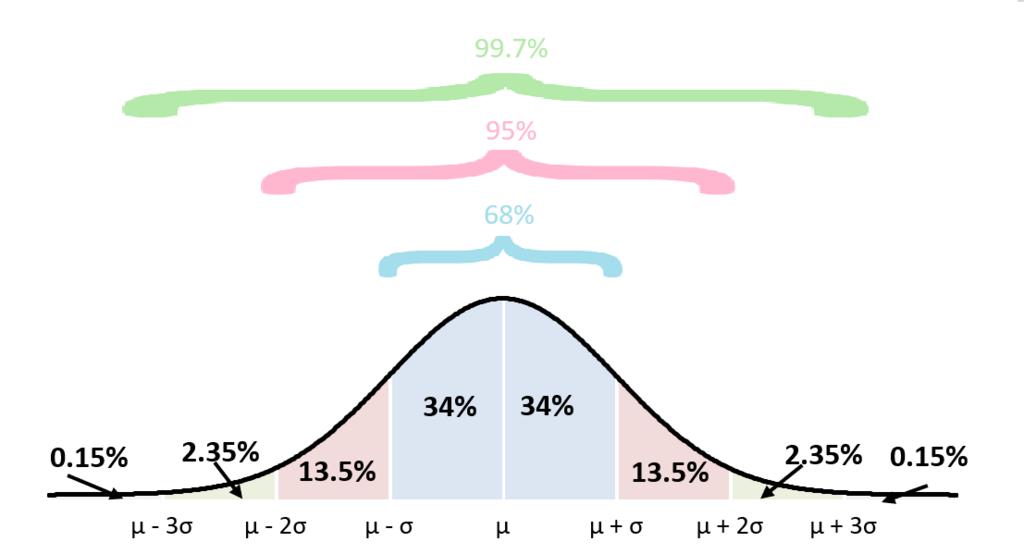
This rule tells us that for a normal distribution:
- About 68% of data falls within one standard deviation of the mean.
- About 95% falls within two standard deviations.
- About 99.7% falls within three standard deviations.
This gives us a predictable way to understand the range of most outcomes in a study.
Is It a Real Effect?
So we've described our data. Now we want to ask bigger questions. Did a new medication actually work, or was the improvement we saw just due to random chance? This is where inferential statistics comes in, using tools like p-values and confidence intervals.
A p-value helps us assess the strength of evidence against a “null hypothesis,” which is usually the assumption that there is no effect or no difference.
The p-value is the probability of getting your observed results (or more extreme results) if the null hypothesis were true.
Let's say a study comparing a new drug to a placebo finds that the drug group recovered faster. The p-value answers this question: If the drug had no real effect, what’s the chance we’d see a difference this large just by luck?
A small p-value (typically less than 0.05) suggests that the observed result is unlikely to be due to chance alone. This is what's called “statistically significant.” It's important to remember that 0.05 is just a common cutoff, not a magic number. It means there's a less than 5% chance of seeing the result if there was no real effect.
While a p-value gives a yes-or-no answer on significance, a confidence interval provides more context.
Confidence Interval
noun
A range of values that you can be a certain percentage confident contains the true population value.
This is much more useful than just a p-value. It tells us the magnitude of the effect and the precision of our estimate. The 95% confidence interval means that if we repeated the study 100 times, we'd expect the true average effect to fall within our calculated range 95 of those times. A narrow confidence interval suggests a precise estimate, while a wide one suggests more uncertainty.
Now, let's test your understanding of these core concepts.
A clinical trial measures the number of days it takes for a new drug to reduce symptoms. The dataset is: [5, 6, 7, 7, 8, 9, 100]. Which measure of central tendency provides the most accurate picture of a typical patient's experience?
A p-value of 0.03 in a medical study typically indicates that the observed results are statistically significant.
These concepts are the building blocks for understanding almost any medical research you'll encounter. They help us move from simple data collection to drawing meaningful conclusions about health and medicine.