how to create a comprehenisve digital student behavior and communication tracker for a middle school teacher
Welcome! I would love to help you build a clean, stress-free digital tracker that actually fits into a busy middle school day without pulling you away from teaching.
Before we map out the design, I want to make sure this tool is perfectly tailored to your classroom needs. Could you tell me a little bit about who you want to track, and if you have a preferred tech platform in mind?
I want to track both class-wide patterns and individual students, but I'm open to any digital tool.
It's great to have you here! Balancing class-wide trends with individual student needs is the secret to a highly functional middle school classroom, but doing it digitally without wasting precious instructional time can be a puzzle.
The Purpose: Finding Your Balance
When we build a tracker, we first need to establish its primary purpose. Middle school is a unique transitional phase where students respond heavily to positive reinforcement, but still require clear, consistent boundaries. A great tracker shouldn't just be a log of s when things go wrong; it should also actively highlight when things go right.
Can I have both?
The Middle School Challenge: Frequency vs. Intensity
Continue to addressing middle school challenges like multiple class periods
The Logistical Trap: Multiple Rosters
- Class-Wide (Macro Tracker): A super-fast score (like 1 to 5) entered once at the bell for each class period, focused entirely on group dynamics like transitions or preparation.
- Individual Self-Monitoring (Micro Tracker): For specific students on behavior plans, they fill out a personal 30-second digital reflection at the end of their period with you, which automatically funnels to your master spreadsheet.
Let's see a diagram of how these tracking flows work together
I would love to show you how these two tracking flows fit together! Visualizing this makes it much easier to see how a two-part digital system can save you time rather than doubling your workload.

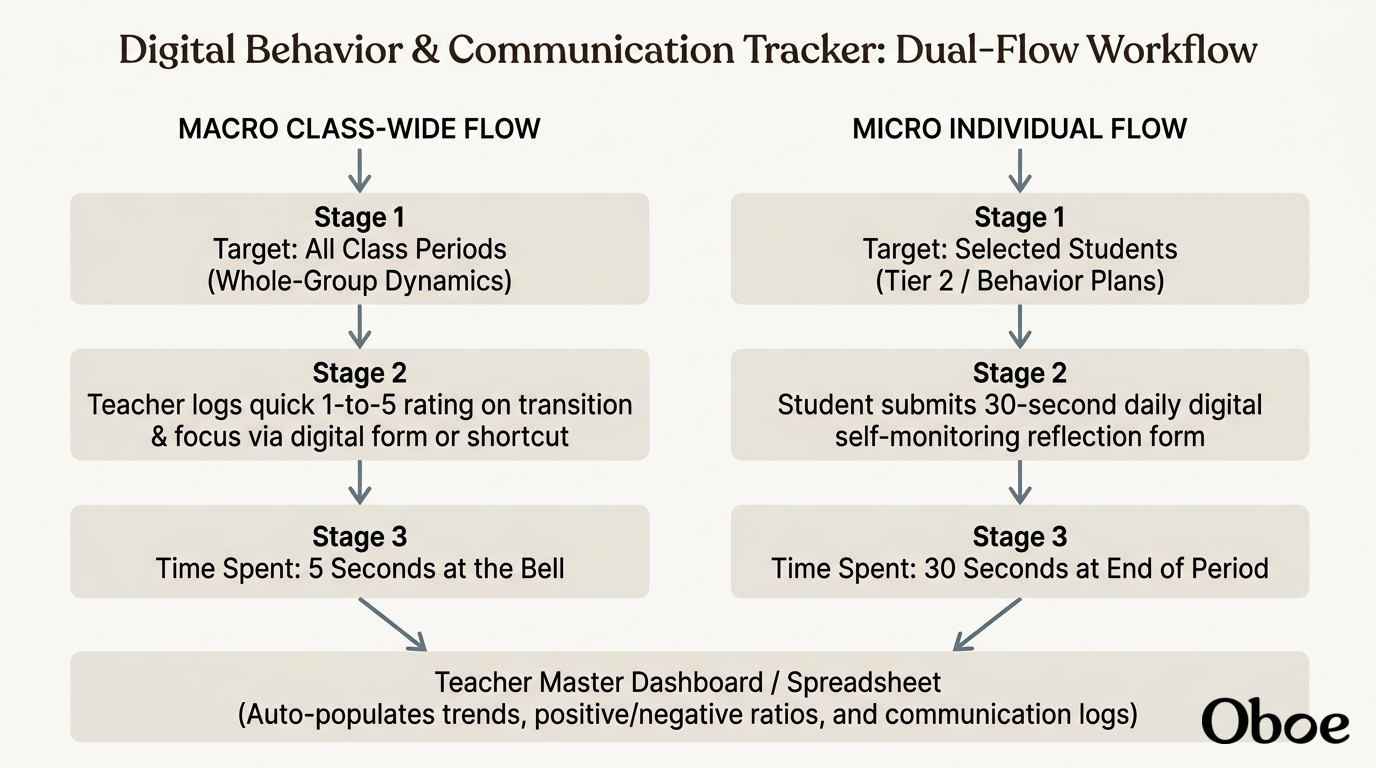
I've started generating that diagram for you. As you'll see when it loads, the beauty of this layout is that you aren't trying to manage both flows at the exact same moment; they happen naturally at the transitions of your class period.
Now that we have a solid strategy for handling multiple class periods and keeping students involved, let's wrap up our first topic. Do you feel confident about how we've defined these initial tracking goals, or would you like to explore how to maintain student and dignity during these active rotations?
Continue to choosing the right digital platform
Now that we have mapped out how our macro and micro tracking flows can work together, it's time to choose the digital engine that will actually run them. The right software needs to be fast enough to use during a hectic 45-minute middle school period, secure enough to protect student privacy, and smart enough to handle your different rosters without extra manual work.
The Three Software Paths
- Lightweight & General (Google Workspace or Microsoft 365): You build custom or MS Forms that automatically feed into Google Sheets or Excel. This is highly customizable and completely free.
- Dedicated PBIS & Behavior Apps: Platforms like or Bloomz that are built from the ground up for school-wide or classroom behavior tracking. These often use point-based systems and have built-in student and parent portals.
- LMS Integrations: Features built directly into the Learning Management System your school already runs (like Canvas, Schoology, or Google Classroom) to keep everything in one central hub.
| Category | Best For | Pros | Cons |
|---|---|---|---|
| Lightweight (Google/MS) | Absolute customization and 100% free pricing. | Zero cost, completely private, you control the exact layout. | Requires initial setup time to build the forms and spreadsheets. |
| Dedicated Apps (LiveSchool/Bloomz) | Point-based systems, instant parent communication, and school-wide tracking. | Beautiful pre-made dashboards, gamified for kids, great reporting. | Can require paid subscriptions; might feel too complex for a single classroom. |
| LMS Integrations | Keeping all grades, assignments, and logs in one single place. | Students already log in daily; no new apps to download. | Behavior tools are often secondary and less customizable. |
To narrow this down, let's look at your school's current tech ecosystem. If your school already relies heavily on a specific suite, we should try to leverage that first to keep things simple.
We use Google Workspace (Forms/Sheets) every day
It is fantastic that you are already using Google Workspace daily. Since you and your students are comfortable with Google Forms and Sheets, we can build a highly customized system that fits right into your existing drive without adding any new software passwords to memorize.
Setting Up Your Roster Management
Continue to designing the Google Form with conditional section logic
Let's dive into setting up that digital switchboard inside Google Forms! Using conditional section logic is the single best way to keep your sanity when managing multiple class rosters.
The Switchboard Method: Step-by-Step
- Create Section 1: Name this section "Class Selection". Add a multiple-choice question: "Which period are you tracking?" and list your classes (e.g., Period 1, Period 2, Period 3).
- Create a separate section for each roster: Click the "Add section" icon (the two parallel rectangles on the floating menu) for each class period you teach. Title them "Period 1 Roster", "Period 2 Roster", and so on.
- Add the students: Inside each of those new roster sections, add your student-specific question. For example, in the "Period 1 Roster" section, create a checkbox or dropdown question listing only your Period 1 students.
- Enable the logic: Go back to your first multiple-choice question in Section 1. Click the three vertical dots in the bottom right corner of that question box and select Go to section based on answer.
A conditional logic mapping of a digital form where selecting Period 2 in Section 1 skips past Section 2 directly to Section 3.
I've started sketching out a visual mockup of this logic flow so you can see how the redirection works in real-time. It's essentially a that automates your navigation, saving you several minutes of administrative overhead every single hour.
Continue to setting up the macro and micro templates
Now that we have our smart switchboard logic ready, we can design the actual templates for your macro and micro tracking flows. Setting these up with the right questions is what keeps your data collection fast, objective, and useful.
The Macro Form: Class-Wide Trendspotting
Your macro tracker is a private form meant only for your eyes. Its job is to capture class-wide behavior trends in just five seconds at the end of each period, before the next group of students walks in.
Instead of listing individual names, this form focus entirely on overall group dynamics. Here is the optimal structure to keep it lightweight:
| Question | Question Type | Why It Matters |
|---|---|---|
| Class Period | Multiple Choice | Triggers your conditional logic switchboard. |
| Focus & Engagement | 1-to-5 Likert Scale | Rates how well the group stayed on task ( is perfect, is chaotic). |
| Transitions & Routine | 1-to-5 Likert Scale | Tracks transition speed (bell-to-bell time management). |
| Quick Notes | Paragraph (Optional) | Spot for quick keywords like 'substitute teacher' or 'assembly disruption'. |
The Micro Form: Private Self-Monitoring
- Did I bring my materials to class? (Yes / No)
- Did I raise my hand to share my thoughts? (Yes / No)
- Did I keep my hands and feet to myself? (Yes / No)
- How do I feel about my focus today? (3-point scale: 😃, 😐, 🙁)
Now that we have the structures planned for both your macro class-wide form and your micro student-facing form, we are ready to route all of this information into a single place.
Should we continue by planning how to connect these two Google Forms to a master Google Sheet to organize your dashboard?
Continue to connecting to your Master Google Sheet
Connecting your forms to a single Google Sheet is where your admin work officially drops to zero. Instead of digging through individual form entries, Google Sheets lets us aggregate all that raw data automatically, setting you up for clean, effortless analysis.
Routing to a Single Source
Designing the Master Dashboard
Once the data is flowing into your master sheet, you can build a third dashboard tab. Instead of manual copying and pasting, we use formulas like to pull class trends and individual student logs into clean, visual tables.
For example, if you want to see a specific student's self-monitoring progress from your micro tracker tab, you can write a formula that dynamically filters the raw entries. Here is what that formula looks like:
Now that you understand how to funnel both streams of data into your master workbook, we are ready to build out the structure of the tracker itself to make sure we are asking the absolute best questions.
Are you ready to move on to structuring the specific categories and scoring methods of your tracker?
Can you help me create one like this https://www.teacherspayteachers.com/Product/Digital-Student-Communication-Tracker-Volume-2-11472753
I love that you shared that template! A comprehensive communication log is a game-changer because it keeps all your parent contact history right alongside your behavioral notes, ensuring you have a bulletproof paper trail.
The Anatomy of a Communication Log
To recreate a professional-grade inside our existing Google Sheet, we want to build a dedicated tab that tracks key information without becoming a chore to fill out.
Every time you call, email, or have a conference, you will input the details into a simple Google Form, and it will auto-populate this new sheet. To make it highly functional for middle school, we should track five core variables:
| Field | Type | Purpose |
|---|---|---|
| Timestamp | Date / Time | Automated by Google Forms to prove exactly when contact occurred. |
| Student Name | Dropdown | Links the contact back to your behavioral rosters. |
| Contact Person | Text / Selection | Identifies who was contacted (e.g., Mom, Dad, Guardian). |
| Method | Multiple Choice | Tracks how you communicated (Email, Phone, In-person, Text). |
| Outcome / Notes | Paragraph | A brief summary of what was discussed and any agreed-upon next steps. |
Bringing It to the Master Dashboard
The real magic of the template you shared is having all this data talk to each other. By using the QUERY or FILTER formulas on your master dashboard tab, we can pull both behavioral points and parent contact history onto a single page.
When you select a student's name from a dropdown menu, the dashboard will instantly display their weekly behavior trend alongside a list of every parent phone call or email you've sent home. This gives you a complete picture of the student's status in under three seconds.
Are you ready to continue by setting up the specific tabs in your Google Sheet and writing the formulas to pull all this together on your master dashboard?
Create a mockup diagram of the master dashboard layout
I would love to sketch this out for you! Visualizing how the different tabs flow together into a single, cohesive interface is the best way to make sure our spreadsheet stays organized and completely automated.
A structural mapping of a spreadsheet master dashboard linking front-end widgets down to their background data-tab sheets.
I've generated a mockup showing how the master dashboard layout bridges your daily forms with a clean, unified view. As you can see, the individual background tabs do the quiet work of collecting the raw details, while your filters that clutter out so you only see what is relevant to the student you are focused on.
To bring this mockup to life, we need to connect our separate Google Forms (the Macro tracker, the Micro tracker, and your new Communication Log) to this master sheet and write the formulas that dynamically feed the dashboard.
Are you ready to continue by learning how to link these multiple forms to the same Google Sheet so they populate separate tabs?
Create a step-by-step checklist document for this setup
I'd love to help you map this out! Creating a step-by-step blueprint is the absolute best way to ensure your forms and spreadsheets connect flawlessly without losing any data in the process.

I've started compiling that step-by-step checklist document for you. Once it loads, it will serve as your exact build guide, detailing how to link your forms to the Master spreadsheet and plug in the core formulas.
To make sure our central dashboard works beautifully, we will use a dedicated query formula to pull the correct rows from your background tabs. When you are ready, I can explain how to set up the spreadsheet layout and write the exact logic to filter your data.
Are you ready to continue to the spreadsheet setup and write the dashboard together?