Bivariate Partial Correlation Explained
Understanding Correlation
What is Correlation?
In the world of data, we often want to know how two things are related. For instance, if you study more, will your test scores go up? If the temperature rises, do ice cream sales also rise? This relationship between two variables is what we call correlation.
Correlation describes the strength and direction of a relationship between two variables.
There are two parts to this relationship: direction and strength.
Direction can be positive or negative.
- A positive correlation means that as one variable increases, the other variable tends to increase as well. Think of study hours and test scores.
- A negative correlation means that as one variable increases, the other tends to decrease. For example, as the number of hours you spend watching TV increases, your test score might decrease.
Strength refers to how predictable the relationship is. If two variables are strongly correlated, knowing the value of one gives you a very good idea of the value of the other. If the correlation is weak, there's a connection, but it's not as clear-cut.
Putting a Number on It
To make this more precise, statisticians use a correlation coefficient. This is a single number that neatly summarizes the strength and direction of the relationship. This coefficient always falls somewhere between -1 and +1.
| Coefficient Value | Meaning |
|---|---|
| +1.0 | A perfect positive correlation. |
| 0.0 | No correlation at all. |
| -1.0 | A perfect negative correlation. |
| 0.8 or -0.8 | A strong positive or negative correlation. |
| 0.3 or -0.3 | A weak positive or negative correlation. |
A value of zero means the two variables are completely unrelated. The closer the value is to +1 or -1, the stronger the relationship. Visualizing the data on a scatter plot makes these relationships easy to see.
Types of Correlation
There are different ways to calculate a correlation coefficient, and the right one depends on your data. The two most common types are Pearson's and Spearman's.
Pearson's r
noun
Measures the strength and direction of a linear relationship between two continuous variables.
The key word here is linear. Pearson's correlation assumes that the relationship between the two variables can be best described by a straight line. It's best used when your data is continuous (like height or temperature) and doesn't have major outliers. For example, Pearson's would be great for analyzing the relationship between the weight of a car and its fuel efficiency.
Spearman's ρ
noun
Measures the strength and direction of a monotonic relationship between two variables.
But what if the relationship isn't a straight line? A monotonic relationship is one where as one variable increases, the other one consistently increases or consistently decreases, but not necessarily at a constant rate.
For example, imagine the relationship between effort and skill in learning a new instrument. At first, a little effort yields big results. Later on, it takes much more effort to make small improvements. The relationship is still positive—more effort leads to more skill—but it's not a straight line. This is where Spearman's rank correlation comes in. It works by ranking the data first, and then measuring the relationship between the ranks. This makes it less sensitive to outliers and suitable for non-linear, monotonic relationships.
A Critical Warning
There's a famous phrase in statistics that you should never forget: correlation does not imply causation. This is the single most important rule to remember.
Understanding the distinction between correlation and causation is crucial for interpreting data accurately.
Just because two variables move together doesn't mean one is causing the other. A classic example is the correlation between ice cream sales and drowning incidents. As ice cream sales go up, so do drownings. Does eating ice cream cause people to drown? Of course not.
A third, hidden variable is at play: temperature. When it's hot outside, more people buy ice cream, and more people go swimming, which unfortunately leads to more drowning incidents. This third variable is called a confounding variable.
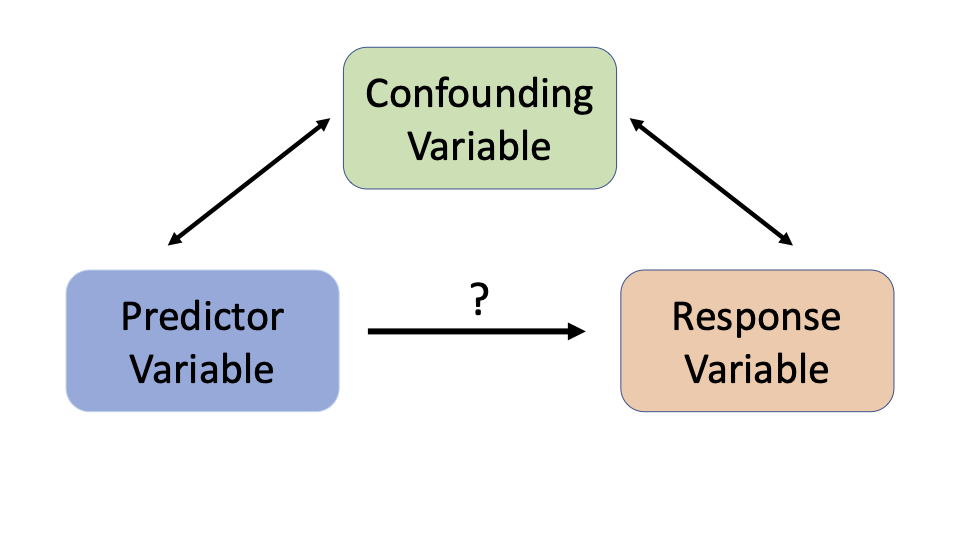
Always be critical when you see a correlation. It's a great tool for identifying potential relationships, but it's just the first step. It tells you what is happening, but it can't tell you why.
Time to check your understanding.
What does a negative correlation between two variables, like hours spent watching TV and test scores, indicate?
A researcher finds a correlation coefficient of +0.85 between study hours and exam performance. How should this be interpreted?
Correlation is a fundamental concept for exploring relationships in data. By understanding how to measure and interpret it, you've taken a big step toward thinking like a data analyst.