Applied Systems Thinking Mastery
Mapping Complex Interdependencies
Beyond the Obvious Links
In any complex system, from a company to a city, the most powerful forces are often the ones you can't see. We know that sales and marketing are connected, but what about the link between the cafeteria's menu and the engineering team's productivity? Or the connection between local zoning laws and a hospital's emergency room wait times?
Mapping these complex interdependencies starts with a critical first step: deciding where your map begins and ends. This is called and it's more of an art than a science. A boundary that's too narrow misses crucial outside influences. A boundary that's too wide makes the map unwieldy and impossible to analyze.
The goal is to define a scope that includes the key variables needed to understand the problem, while excluding noise. Ask yourself: what factors can we influence, and what factors are part of the external environment we must simply react to? This choice fundamentally shapes the story your map will tell.
A good system boundary captures the problem's core dynamics without trying to model the entire universe.
Uncovering Hidden Connections
Once you've set your boundaries, the next step is to identify the relationships between the variables inside. Some are obvious, but the real insights come from mapping the non-obvious interdependencies. A great tool for this is the cross-impact matrix.
It's a simple grid that forces you to consider how every element affects every other element. You list all the key variables of your system both down the left side and across the top. Then, for each cell in the grid, you ask: does the variable in this row have a direct impact on the variable in this column? This methodical process helps uncover connections you might otherwise overlook.
| Employee Morale | Product Quality | Customer Support Tickets | |
|---|---|---|---|
| Employee Morale | - | Strong positive | Strong negative |
| Product Quality | Strong positive | - | Strong negative |
| Customer Support Tickets | Strong negative | Weak negative | - |
In the example above, we see the expected links, like morale affecting quality. But the matrix also forces us to consider the reverse: does product quality affect morale? Yes, high quality can boost pride and morale. Does an increase in support tickets affect product quality? It might not directly, but it pulls resources away from development, creating a weak negative link.
This structured approach moves beyond simple brainstorming and helps build a more comprehensive picture of the system's internal wiring. It's the first step toward visualizing the whole system, not just its most visible parts.
Mapping the Whole System
A truly powerful map integrates multiple sectors. Social issues, economic pressures, and environmental constraints don't operate in isolation. A multi-sector map visualizes these interwoven systems simultaneously. For example, a city planning map might connect traffic patterns (economic), air quality (environmental), and public health outcomes (social).
Mapping these connections reveals how a solution in one area can create problems in another. Adding a new highway might ease traffic but worsen air quality and displace communities. This is a classic policy resistance scenario, where intuitive solutions fail because they ignore hidden systemic connections. A comprehensive map helps anticipate these unintended consequences.
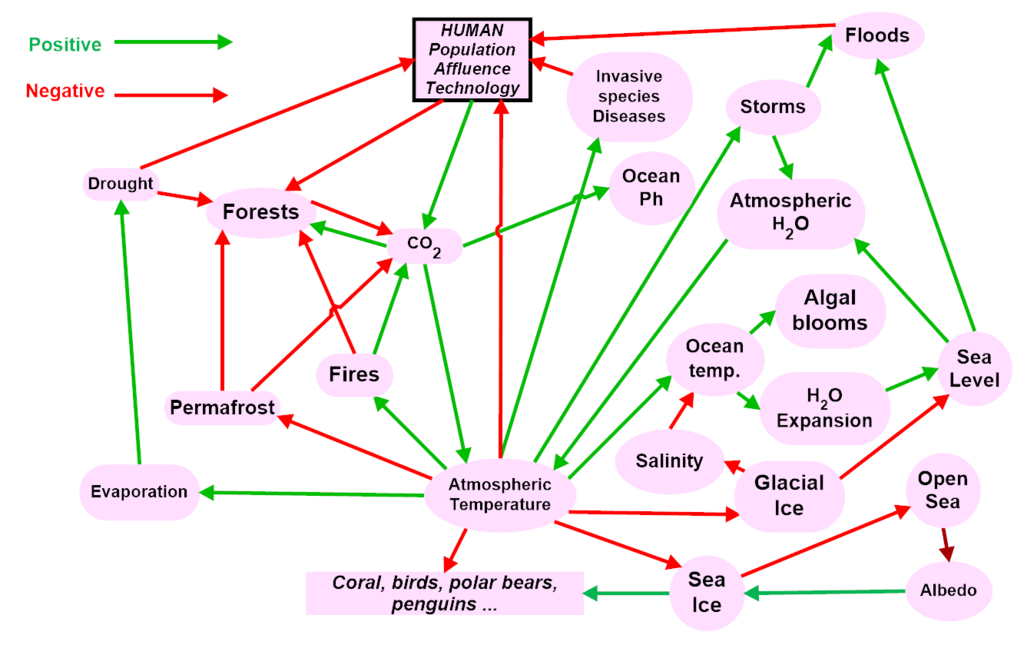
The final map is more than a diagram; it's a story about how a system works. The quality of a map isn't measured by the number of boxes and arrows, but by the richness of the connections it reveals. It's about showing how a change in one corner of the system can ripple through and create unexpected effects elsewhere.
This level of analysis moves beyond simple problem-solving. It's about understanding the deep structure of a system so you can find leverage points, the small, well-focused actions that can produce significant, lasting improvements.
Ready to test your understanding of these mapping techniques?
What is the primary goal of "system boundary selection" when mapping a complex system?
A city builds a new highway to reduce traffic congestion. However, this leads to increased air pollution and displaces a local community, causing unforeseen social and health issues. This outcome is a classic example of what?
By mastering these mapping techniques, you can start to see the hidden architecture that shapes our organizations and societies.