Algebra 2 Fundamentals
Functions and Graphs
What is a Function?
Think of a function as a simple machine. It takes an input, does something to it, and produces a single, predictable output. For every specific input you give it, you will always get the same exact output. A coffee machine is a good analogy. You put in a coffee pod (the input), and you get out a cup of coffee (the output). You can't put in a coffee pod and get out tea. That's the key idea: one input, one unique output.
function
noun
A mathematical relationship between a set of inputs and a set of permissible outputs with the property that each input is related to exactly one output.
In math, we usually call the input and the output . The function itself is the rule that connects to . For example, the rule could be "double the input." So if you put in a 3, you get out a 6. If you put in a 5, you get out a 10. The relationship is consistent.
Domain and Range
A function's machine doesn't necessarily accept every possible input. The set of all valid inputs for a function is called the domain. Think of it as the types of coffee pods your machine accepts. Maybe it only takes a specific brand.
Similarly, the machine might only be able to produce a certain set of outputs. The set of all possible outputs is called the range. If our coffee machine can only make espresso or lungo, then its range is {espresso, lungo}, even if there are hundreds of other coffee types.
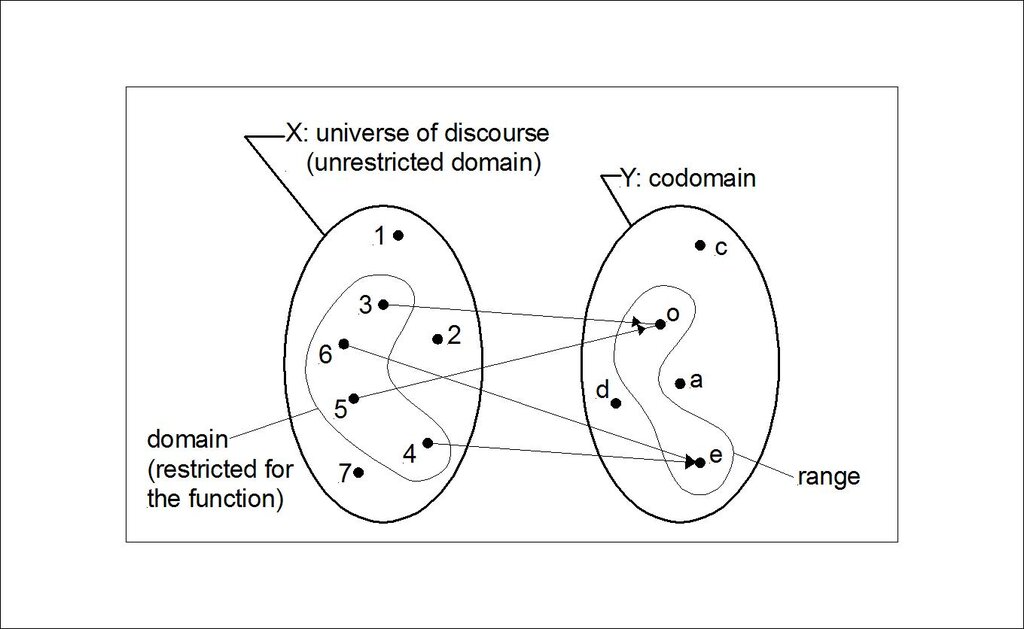
Let's consider a mathematical example. For the function , you can't take the square root of a negative number (at least, not without getting into complex numbers, which we'll ignore for now). So, the domain is all non-negative numbers, which we can write as .
What about the range? The square root of a non-negative number is always another non-negative number. So, the range is also all non-negative numbers, or .
Domain: What can I put in? Range: What can I get out?
A Tour of Common Functions
Functions come in many flavors. Learning to recognize their basic shapes and properties is a core skill in algebra. We'll look at their equations and their graphs, which are visual representations of the input-output relationship.
Linear Functions: These are the simplest. Their graphs are straight lines. The general form is . The value is the slope (how steep the line is), and is the y-intercept (where the line crosses the vertical y-axis).
Quadratic Functions: These have the general form . Their graphs are U-shaped curves called parabolas. They can open upwards or downwards.
Polynomial Functions: This is a broader category that includes linear and quadratic functions. A polynomial is an expression with multiple terms involving powers of , like . Their graphs can have multiple twists and turns.
Rational Functions: These are fractions where the numerator and denominator are both polynomials, like . Their graphs often have breaks called asymptotes, which are lines the graph gets closer and closer to but never touches.
Exponential Functions: These model rapid growth or decay, like population growth or radioactive decay. The variable is in the exponent, as in . They grow very quickly.
Logarithmic Functions: These are the inverses of exponential functions. They answer the question, "what exponent do I need to get this number?" For example, because . Their graphs show very slow growth.
Function Notation
Instead of writing , we often use function notation: . You read this as "f of x equals 2x plus 1." The letter is just a name for the function; we could also use or .
This notation is useful because it's a compact way to show what input we are using. If we want to know the output when the input is 3, we write . To find its value, we just replace every in the rule with 3.
So, . This is another way of saying that when the input is 3, the output is 7. On a graph, this corresponds to the point (3, 7).
Let's test your understanding of these core ideas.
Which statement best describes a mathematical function?
Given the function , what is the value of ?
Understanding functions and their graphs is like learning the grammar of mathematics. It provides the structure for describing relationships and modeling the world around us.