Advanced Microsoft Visio Mastery
Complex Process Modelling
Beyond the Basic Flowchart
Simple flowcharts are great for mapping out straightforward, linear processes. But what happens when a process crosses multiple departments or involves several different people? A simple diagram quickly becomes a tangled mess of crisscrossing lines. To solve this, we use a Cross-Functional Flowchart, also known as a swimlane diagram.
Imagine a swimming competition. Each swimmer stays in their own lane, but they are all part of the same race. Swimlane diagrams work the same way. Each lane represents a different department, role, or person, showing their specific tasks within the larger process.
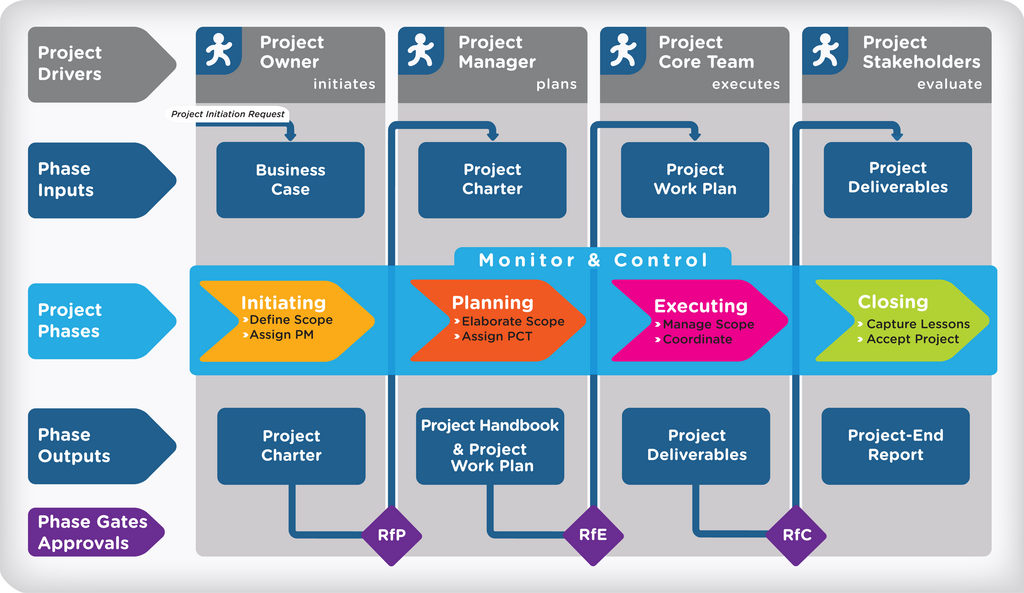
This structure immediately clarifies who is responsible for what. The process flows sequentially, usually from left to right, but the tasks are partitioned into horizontal or vertical lanes. This makes it easy to spot handoffs between teams and identify potential bottlenecks where one department is waiting on another.
Structuring Complex Processes
To map complex workflows effectively, we need more than just lanes. We need tools to show phases, group related tasks, and manage the visual flow.
First, consider the orientation. Swimlanes can be arranged horizontally or vertically. Horizontal layouts are very common and read naturally like a timeline from left to right. Vertical layouts can be useful for processes with many participants but fewer steps, and they often fit better on vertically oriented screens.
There's no single right answer for orientation. Choose the layout that tells the story of your process most clearly.
Next, you can add structure by dividing the process into phases. Just like a project has milestones, a process can be broken down into stages like 'Requirements Gathering,' 'Development,' and 'Testing.' You can represent these by adding vertical separator lines that cut across all the swimlanes. This adds a time-based dimension to your map, showing not just who does what, but also when it happens in the overall lifecycle.
Within a single lane, you can group related steps using a container. This is simply a box drawn around a few tasks to show they are part of a discrete sub-stage. For example, in a 'Hiring' lane for an HR manager, you might have a container for 'Candidate Screening' that includes the steps 'Review CV,' 'Initial Phone Call,' and 'Schedule Interview.' This keeps the diagram tidy and groups low-level tasks into logical units, a key principle in formal notations like s.
Linking and Scaling
Even with containers and phases, a flowchart for a massive organizational process can become unwieldy. Trying to map every single click and decision for an entire product launch on one page is a recipe for an unreadable diagram. This is where subprocesses come in.
A subprocess is a self-contained process that is part of a larger one. In a flowchart, you can represent it with a special shape, often a rectangle with bolded borders or a plus sign inside. This shape acts as a link or a placeholder. It signifies that a whole other detailed flowchart exists for that specific step.
For example, a high-level order fulfillment process might have a single step called 'Process Payment.' This could be a subprocess shape that links to a separate, detailed diagram showing every step of credit card authorization, fraud checking, and transaction logging.
This technique is essential for achieving in process mapping. It allows you to create a high-level master diagram that gives a clear overview of the end-to-end process, while keeping the nitty-gritty details tucked away in linked sub-diagrams. Viewers can understand the main flow at a glance and then zoom into specific subprocesses as needed. It keeps your master document clean and focused on the big picture.
From Data to Diagram
Manually drawing a large, complex swimlane diagram can be time-consuming and prone to errors. For processes that are already documented in a structured format, there's a more efficient way: data-driven visualization.
Tools like Microsoft Visio include a feature called the Data Visualizer. This powerful tool acts as a bridge between raw process data in an Excel spreadsheet and a polished, professional flowchart. You simply structure your process data in an Excel template, with columns for things like Process Step ID, Description, Next Step ID, and crucially, a column for 'Function' or 'Lane'.
Once your data is prepared, you point the Data Visualizer to your Excel file. It reads the data, understands the relationships between steps, and automatically generates a complete swimlane diagram. Each unique value in your 'Lane' column becomes a swimlane, and the process steps are placed within them and connected according to your specifications.
This method is not only faster but also ensures your diagram is a direct, accurate representation of your data. If the process changes, you can simply update the Excel file and refresh the diagram, rather than manually re-drawing shapes and connectors.
Mastering these advanced techniques elevates flowcharting from a simple drawing exercise to a strategic tool for business analysis. You can model, understand, and communicate even the most intricate organizational workflows with clarity and precision.
What is the primary purpose of a cross-functional flowchart, also known as a swimlane diagram?
In a swimlane diagram, how would you visually separate major stages of a project, such as 'Requirements Gathering', 'Development', and 'Testing'?