
Oboe
No history yet

the 2008 financial crisis

Welcome! I'm glad you're here to unpack the 2008 financial crisis—it's one of the most fascinating and critical chapters in modern economic history.

To help me tailor our conversation perfectly to you, what brings you to learning about the crisis today, and how much prior knowledge do you have about economics or how this crash went down?

I have some economics background but want to understand the mechanics better.

It's great to have you here! Since you already have some background in economics, we can skip the basics and dive straight into the precise, systemic machinery that triggered the crash.

Your path
Wall Street and Financial Contagion
Government Response and Bailing Out
Economic Impact and Lasting Reforms

The Post-Dot-Com Setup

To understand the mechanics of the 2008 crisis, we have to start in the early 2000s, right after the burst and the September 11 attacks shook the global economy. In response to these shocks, the Federal Reserve slashed its benchmark interest rate—the federal funds rate—from 6.5% down to a historic low of just 1.0% by 2003. This dramatic cut flooded the financial system with cheap credit. When treasury yields fell alongside those rates, global investors became desperate for higher-yielding, safe investments, and they turned their eyes toward the U.S. housing market.

The Fed's Lever

Let's look at exactly how the central bank adjusted the cost of borrowing money during this era. Below is the dynamic of the benchmark interest rate path leading into the crisis.

A line chart tracking the Federal Funds Rate from 2000 to 2008.

With the Fed's benchmark rate down to 1.0%, banks could borrow money incredibly cheaply. Because holding cash yielded almost nothing, institutions were highly motivated to lend money out to generate returns. This created a massive supply of cheap mortgages, driving up home prices and initiating a self-reinforcing housing boom.

Make a diagram of this capital flow

You've got it! Visualizing this pipeline is the absolute best way to see how the system operated.
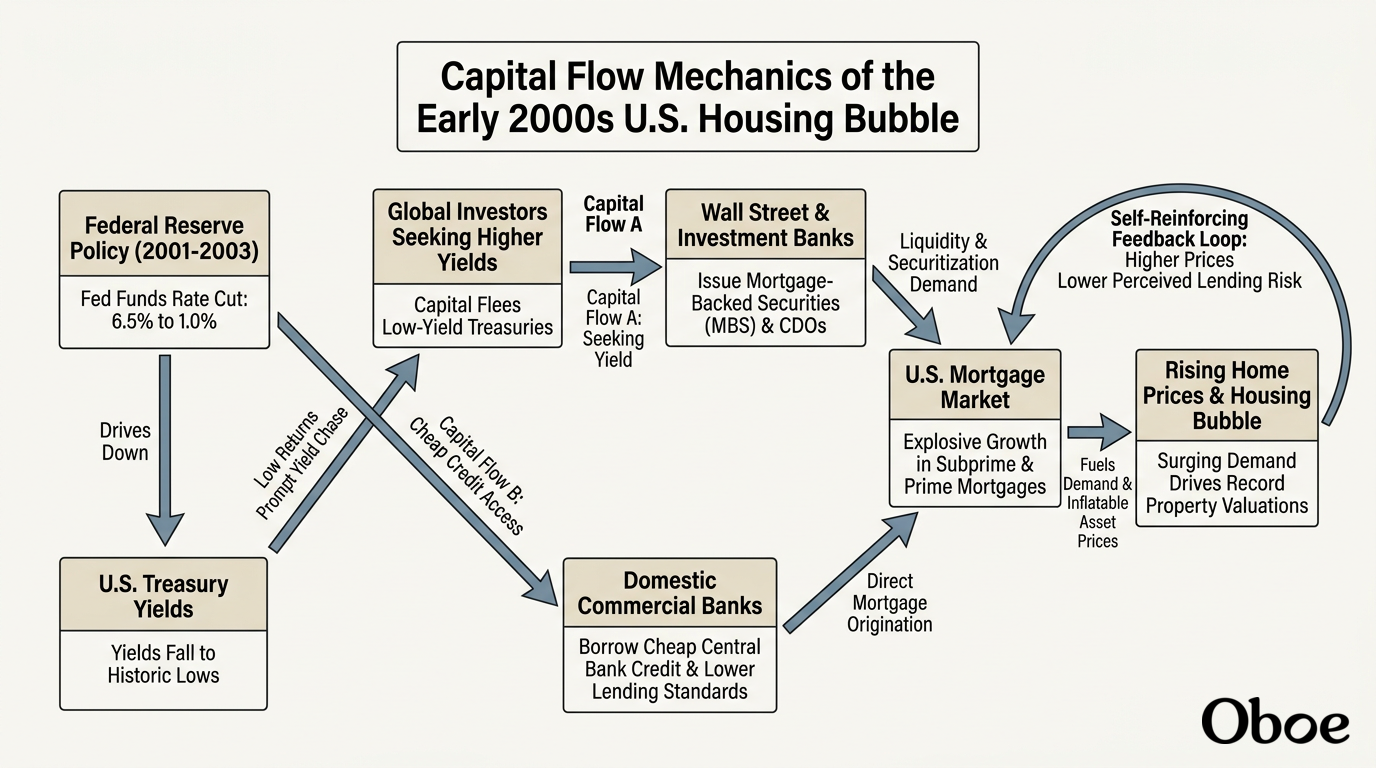
Capital Flow Mechanics of the Early 2000s U.S. Housing BubbleDiagram
I have kicked off the generation of a diagram that maps out how this flood of money moved through the system. You'll see how low central bank rates forced global investors to search elsewhere for return, while simultaneously giving local banks cheap money to lend out. As this cash sought a home, it ran headfirst into the consumer lending market. Because interest rates were so low, standard investments like government bonds weren't yielding much of anything. Wall Street needed a new engine to generate high returns, and they found it in the American homebuyer.

Why did investors think housing was safe?

That's the million-dollar question—and answering it reveals the fundamental blind spot that allowed the bubble to grow so massive in the first place.

Historically, the United States had never experienced a simultaneous, nationwide crash in housing prices. Real estate was considered highly localized. If a economic slump hit the Rust Belt, the Silicon Valley housing market would stay perfectly fine. Because of this historical trend, Wall Street models relied on a major assumption: . Analysts figured that even if they pooled thousands of mortgages from across the entire country into a single investment, a few defaults in one state wouldn't sink the overall pool. To them, American housing felt as safe as a government bond, but with a much better yield.
Because investors believed housing was fundamentally safe, they were eager to buy structured debt. This brings us to how Wall Street packaged these loans: Mortgage-Backed Securities (MBS) and Collateralized Debt Obligations (CDOs). To make these complex bundles attractive, financial institutions needed rating agencies to stamp them with highly coveted, risk-free rating grades. Let's look at how that rating system worked.
Rating GradePerceived Risk LevelTarget Investor Class
AAAPrime / Risk-FreePension Funds, Insurance Companies
AA to BBBModerate / Investment GradeCommercial Banks, Asset Managers
BB and BelowHigh / Speculative JunkHedge Funds, High-Yield Investors
To satisfy the global hunger for yield, Wall Street wanted to turn ordinary home loans into AAA-rated investments. Next, we can look at the exact mechanics of how these loans were bundled and structured to pull off that financial alchemy.

Create a diagram of how mortgage bundling worked

You've got it! Visualizing how these individual loans were packaged is the best way to understand the mechanical transition from simple mortgages to high-yield Wall Street products.
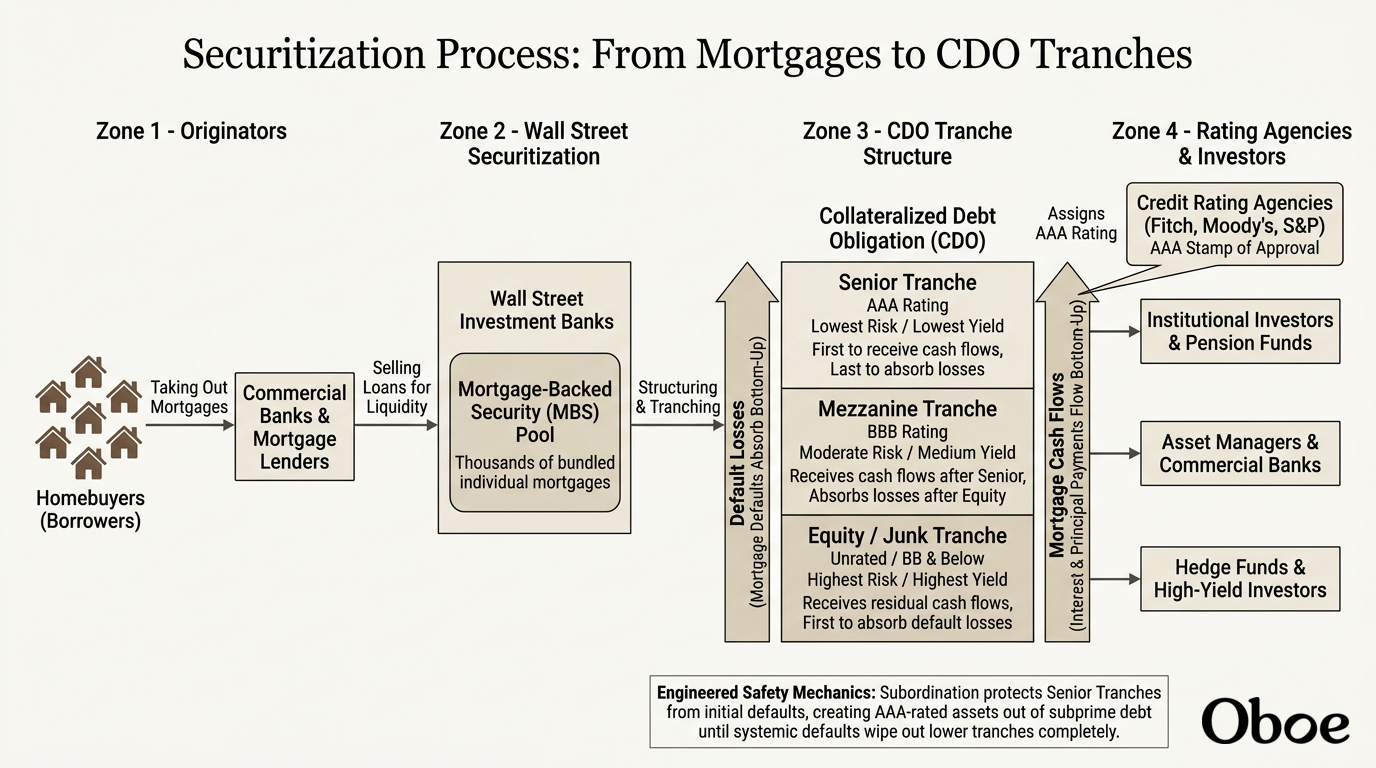
Securitization Process: From Mortgages to CDO TranchesDiagram
I've started generating that diagram so you can trace the exact plumbing of . This process of slicing and dicing mortgages into different tranches (tiers of risk) was a masterclass in financial engineering. By structuring the cash flows so that the top tier got paid first, Wall Street successfully convinced rating agencies that the top slice of the CDO was completely risk-free, receiving that coveted AAA rating. But this system had a fatal flaw: it was incredibly hungry. To keep making these highly profitable structured products, investment banks needed a continuous supply of raw material—more mortgages. And by 2004, they had already loaned money to almost every creditworthy, 'prime' homebuyer in America. To keep the machine running, lenders had to find new borrowers, which triggered a massive shift toward and a rapid decline in underwriting standards.