No history yet

A lesson plan to teach qualitative versus quantitative observations

Welcome! I would love to help you build an engaging lesson plan for this topic. Before we dive into the concepts and structure, could you tell me who you are teaching this to?

Middle school students (Grades 6-8)

Middle school is the perfect age to teach this because kids are naturally curious about the world around them, but they often struggle to turn that curiosity into structured, scientifically useful observations.

Your path
Identifying Observations
Applying Observations
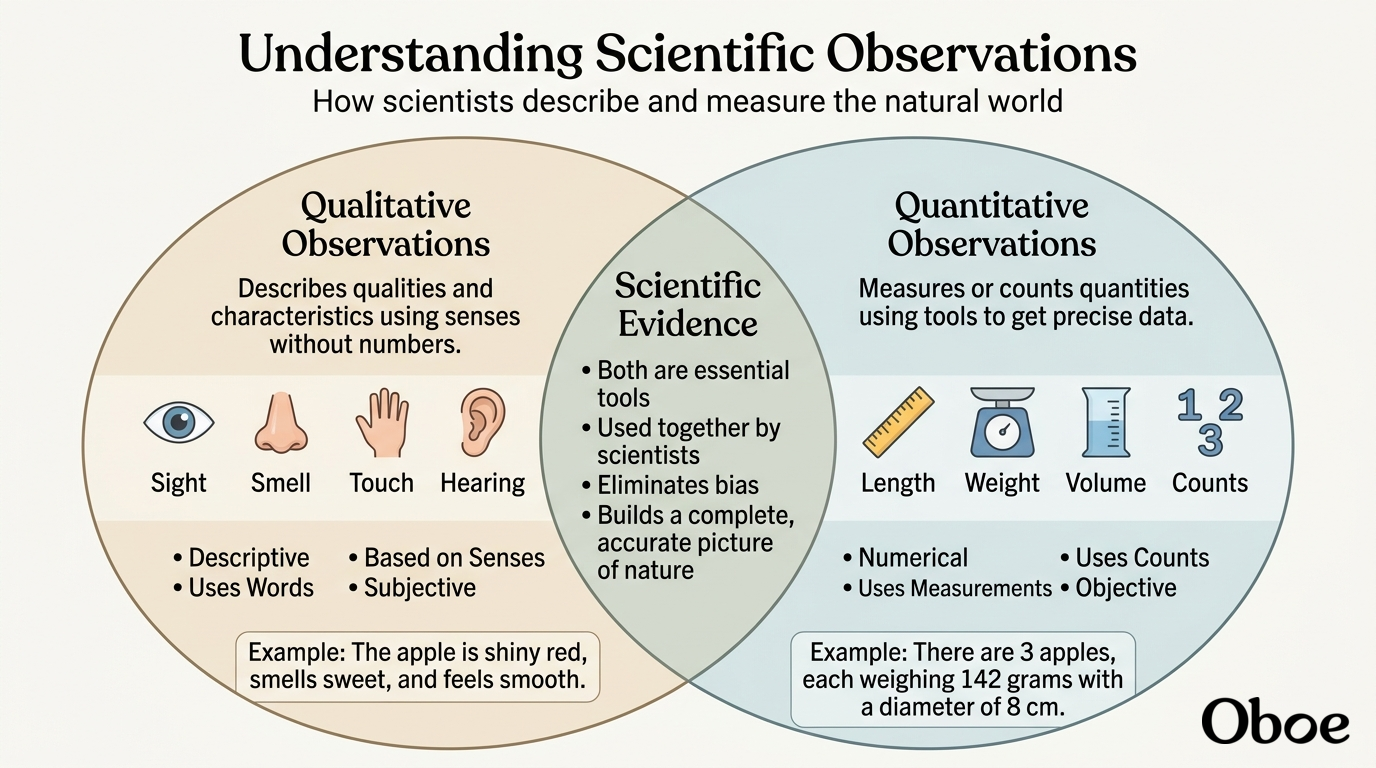
Let's kick things off with our very first milestone: defining . When we ask students to make a qualitative observation, we're asking them to look at the qualities of an object. This means they are using their senses—sight, smell, touch, taste, and hearing—to describe what they experience without using any numbers. Think of it as painting a picture with words. If you hand a middle schooler an apple, and they tell you it is "shiny red," "sweet-smelling," or "smooth," they are making qualitative observations.

Continue to defining quantitative observations

Let's pivot from the sensory side of things to the world of numbers and measurements: . When students make a quantitative observation, they are focusing on quantities. This means they are measuring or counting something to get objective data. If qualitative observations paint a picture with words, quantitative observations define that picture with precise numbers and units.
To keep the apple example going: if a student notes that the apple "weighs 142 grams," "has a diameter of 8 centimeters," or simply that "there are 3 apples on the desk," they are making quantitative observations.

Make a quick diagram comparing the two types of observations

I would love to help you visualize this! A side-by-side visual comparison is the perfect tool to help middle schoolers easily digest the difference between these two observation types before they start practicing.

DIAG
Diagram
Generated course diagram
While that comparative diagram is generating, let's explore why both are absolutely essential in science. Middle schoolers often think quantitative data is "better" because it uses numbers, but that is not the case. A scientist needs both. If you only look at numbers, you miss the color, texture, and behavior. If you only look at qualities, you miss the precise, measurable, and testable facts. For example, if you are studying a new species of frog, knowing it has "bright blue skin" (qualitative) is just as vital for understanding its survival warnings as knowing it weighs "24 grams" (quantitative). They work together to tell the whole story.