
Fintech Architecture & Analytics: 1) API-first design & webhooks. 2) Data pipelines & SQL. 3) System reliability & API monitoring. 4) RBAC Dashboards for CEO (global metrics), Staff (regional supervisor tracking), & Field Agents (referral signups, active users, commission payouts).
Welcome! I'm excited to help you dive into the world of Fintech Architecture and Analytics. Before we build out our learning roadmap, I'd love to learn a little more about what you're looking to get out of our time together.
I'm a complete beginner to APIs and database design!
Since you are brand new to APIs and database design, let's take a quick moment to lay down a solid foundation before we start building fintech architectures. Having a clear mental model of how systems talk to each other will make the technical blueprints we are about to cover feel much more natural.
The Restaurant Analogy
When you want to check your balance, your app sends a structured request (an API call) to the bank's server. The server verifies who you are, looks up your balance in its database, and sends the answer back to your app to display on your screen.
Does this basic "client-waiter-kitchen" picture make sense to you, or would you like to explore how they communicate in a bit more detail?
That makes total sense! Let's dive deeper into how they communicate.
I love that energy! Since the client-waiter-kitchen model is clear, let's look at exactly how they communicate. Every time a client talks to a server, it uses a standardized language called HTTP (Hypertext Transfer Protocol).
The Anatomy of an HTTP Request
When your phone asks the bank's server for your transaction history, it packages that request into a very specific structure. Think of this request as a physical letter you're mailing. It needs an address, an action, and sometimes a parcel inside. In HTTP, this breaks down into three key parts:
-
The Method (The Action Verb): What do you want to do? The most common verbs in fintech are GET (please retrieve this data for me, like fetching your account balance) and POST (please create or submit new data, like sending a payment of $50 to a friend).
-
: These are the envelope's metadata. They contain vital background details, such as who is sending the request, the format of the data being sent, and secure to prove you have permission to access the account.
-
The Body (The Payload): This is the actual parcel inside the envelope. When you use a GET request to read data, the body is usually empty. But when you make a POST request to transfer money, the body contains the exact details of the transaction, such as the recipient's account number and the amount to send.
To make this concrete, let's look at how a real mobile app tells a backend server to process a new payment. Since we're dealing with structured data, this request body is written in JSON (JavaScript Object Notation), which is the standard format for modern APIs.
POST /v1/payments HTTP/1.1
Host: api.yourbank.com
Authorization: Bearer secure_token_123
Content-Type: application/json

{
  "recipient_id": "acc_98765",
  "amount": 150.00,
  "currency": "USD",
  "memo": "Electric bill payment"
}
In this example, the app uses POST to target /v1/payments on the bank's domain. The headers provide the security token and specify that the format is JSON. The body holds the actual data payload: the recipient's ID, the amount, the currency, and a brief note.
How does this structure feel? Are you ready to see how the server responds back, or would you like to test your understanding of this request format first?
Quiz me on HTTP requests!
Let's put your understanding of HTTP requests to the test!
Imagine a user is trying to check their current balance on a mobile banking application. Since this action is strictly retrieving existing account data rather than modifying it, which of the following represents the most appropriate HTTP method and setup?
A GET request targeting the balance endpoint with an empty request body.
 Skills
Spot on! A GET request with an empty body is the gold standard for reading information without changing anything on the server.
Now that you have the client's request down, let's flip the coin and look at how the server answers back using and JSON payloads.
Understanding Server Responses
When the bank's server finishes processing our request, it sends back a response envelope. Just like the request, this response contains headers and an optional JSON body. Most importantly, it starts with a three-digit status code.
Here are the five most critical response codes you must know when building or troubleshooting fintech systems:
| Status Code | Name | What It Means in Fintech |
|---|---|---|
| 200 | OK | Success! Your balance query or data retrieval completed perfectly. |
| 201 | Created | Success! A new resource, like a payment record or user account, was created. |
| 400 | Bad Request | The server couldn't understand the request (e.g., a missing JSON parameter). |
| 401 | Unauthorized | Authentication failed. The secure token is missing, expired, or invalid. |
| 500 | Internal Error | The server's database went down, or an unexpected bug crashed the backend. |
To tie this together, if our payment request from earlier is successful, the server might send back a 201 Created status code along with this JSON payload inside the response body:
HTTP/1.1 201 Created
Content-Type: application/json

{
  "transaction_id": "tx_abc123xyz",
  "status": "completed",
  "timestamp": "2026-08-11T14:50:00Z",
  "balance_remaining": 1350.00
}
This payload tells the client app exactly what happened: the transaction succeeded with a unique tracking ID, and the user's remaining balance has updated to $1,350.00.
Would you like to test your understanding of these status codes with a quick scenario-based question, or are you ready to continue to contract-first API design using OpenAPI?
Generate a study guide on HTTP
I have created the comprehensive HTTP and Server Response Study Guide you requested to help consolidate these foundations before we move on to contract-first API design.
Make me a diagram explaining contract-first API design
Ask and you shall receive! Let's map out exactly how contract-first API design works using a visual blueprint.
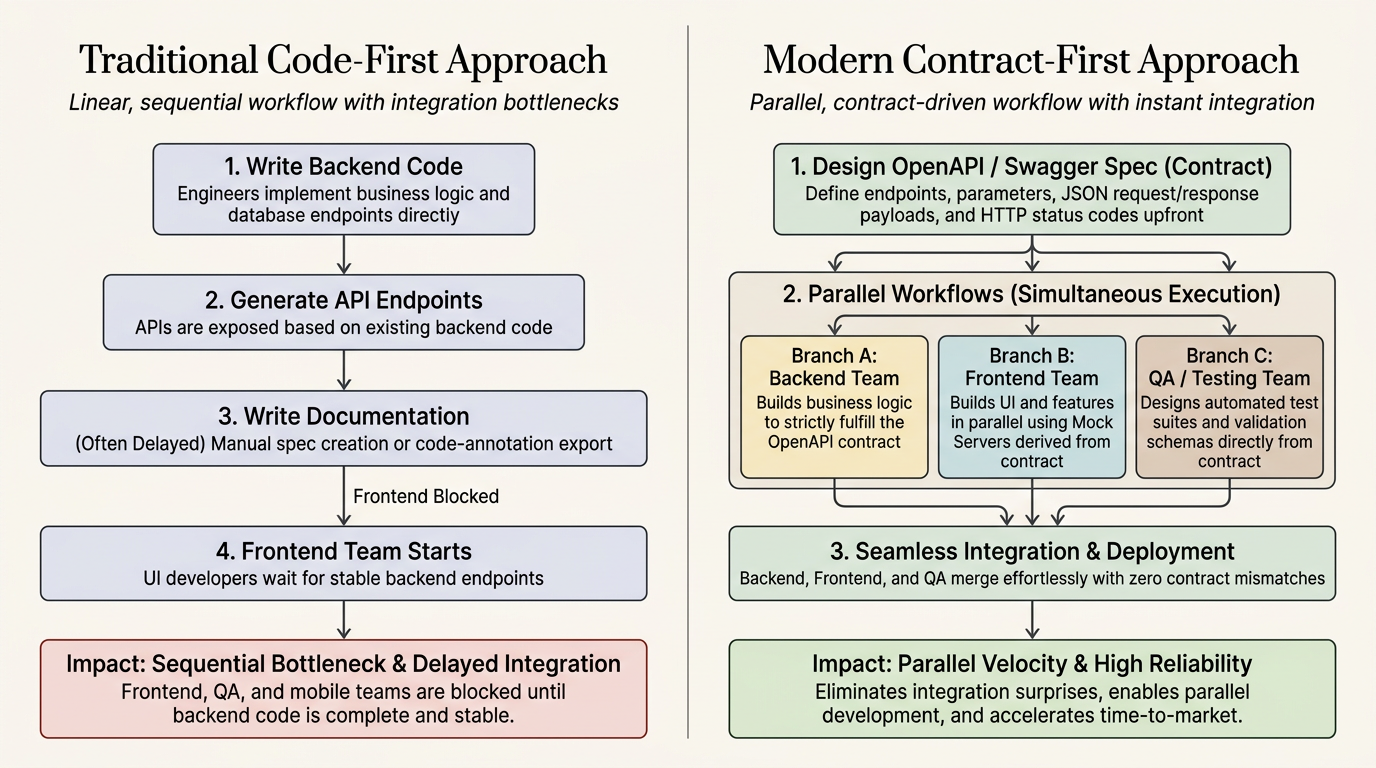
I've kicked off the generation of a diagram to visualize how contract-first API design acts as a massive accelerator for engineering teams.
By establishing the as the single source of truth up front, the backend, frontend, and QA teams can run in parallel. Nobody is stuck waiting around for code to be written just to know how the data will look.
Now that you see how we lay the blueprints for requests and responses, we're ready to tackle how servers proactively push information back to us when things happen in real time.
Let's move on to the world of event-driven webhooks!
Continue to event-driven webhooks and triggers
To understand why we need webhooks, let's look at how systems traditionally shared data. Imagine you are waiting for an important package to arrive at your house. If you keep opening your front door every five minutes to check if it's there, you are wasting a massive amount of energy.
Polling vs Webhooks
A side-by-side comparison of API architecture workflows for Polling and Webhooks.
Quiz me on Polling vs Webhooks
Let's put your understanding of polling and webhooks to the test with a real-world scenario.
Imagine you are building a mobile investing application. One of your users has just initiated a deposit of $500.00 from their traditional bank account into their investing wallet. Because standard bank transfers take a few days to fully clear, the transaction starts in a pending state.
Which of the following designs represents the most efficient, modern fintech architecture to update the user's interface the exact second the funds actually clear?
The bank's server sends a POST request to your webhook listener endpoint immediately when the payment status changes to cleared.
You nailed it! Having the bank's server proactively send an HTTP POST request directly to your webhook listener the very millisecond the payment clears is the ultimate way to achieve real-time updates without wasting any resources.
The Security Challenge: Webhook Spoofing
Now, let's look at the flip side. Because your has to be a public URL on the internet so the bank can reach it, this exposes a massive security risk. Anyone who finds that URL could theoretically send fake success payloads to your server, pretending they deposited $1,000,000.00.
To prevent this, fintech architectures use HMAC signatures (Hash-based Message Authentication Codes).
Think of an HMAC signature as a unique, unforgeable wax seal on a letter. When the payment gateway sends a webhook payload, they run the raw payload data through a mathematical hashing algorithm (like SHA-256) combined with a secret key that only you and the gateway know. This generates a long string of random-looking characters: the signature.
They attach this signature inside an HTTP header (often named X-Signature or Stripe-Signature).
When your server receives the payload, you perform the exact same mathematical calculation using your copy of the shared secret. If your calculated signature matches the one in the header, you have absolute proof of two things:
- Authenticity: The request genuinely came from your payment provider, not an impostor.
- Integrity: The payload wasn't tampered with or modified in transit.
An HMAC signature verification workflow across four sequential processing stages.
I've generated a visualization mapping out this validation handshake so you can see exactly how signatures keep bad actors from spoofing transaction updates.
If the signatures don't match, your server instantly drops the request and throws a 401 Unauthorized error. This simple mathematical check is what keeps billions of dollars in webhook-driven financial data perfectly secure every day.
How does this security handshake feel? Would you like to see how we handle webhooks when the network drops (retries and idempotency), or should we quiz you on HMAC verification first?
Quiz me on HMAC verification!
Let's put your understanding of HMAC security to the test! It is crucial to prove that incoming webhook traffic is legitimate before updating user ledger balances.
You generate a signature using your shared secret and compare it to the signature header.
You nailed it! Generating your own signature using the shared secret and comparing it to the incoming X-Signature header is the gold standard for verifying webhook authenticity.
Now that we have secured our webhook communication channel, let's explore what happens when the real world gets messy. In production environments, network connections drop, destination servers crash, and API requests get interrupted.
To build a highly reliable fintech architecture, we must address two final webhook challenges: exponential backoff retries and idempotency keys.
Handling Webhook Failures and Duplicates
Imagine a payment gateway tries to send your server a webhook notification, but your server is undergoing a brief deployment and is temporarily offline. If the gateway only tries to deliver that message once, your system will completely miss the event, and the user's balance will never update.
To solve this, gateways use an retry strategy. Instead of spamming a failing server immediately, the gateway waits increasingly longer periods between retry attempts (e.g., waiting 5 seconds, then 10 seconds, then 30 seconds, then 2 minutes, and so on) before eventually moving the message to a dead-letter queue for manual review.
While retries ensure that messages are eventually delivered, they introduce a secondary problem: duplicate messages.
If the payment gateway sends a webhook POST request, but a network hiccup prevents your server's success response from reaching back to the gateway, the gateway will assume your server never got the message. It will retry and send the exact same payload a second time.
If your listener blindly processes every request it receives, you might accidentally credit a user's account twice for a single payment! To prevent this, fintech systems enforce .
To achieve idempotency, the payment gateway includes a unique Idempotency Key (usually a unique UUID) in the webhook header or JSON payload.
When your server receives a webhook, it checks a fast database cache (like Redis) to see if it has already processed that specific key. If the key exists, your server simply returns the cached success response from the first attempt without executing any business logic again. If the key is new, your server processes the payment, saves the key, and returns the response.
A webhook retry workflow contrasting a network timeout duplicate entry risk with an idempotency key cache hit.
I've started generating an interactive sequence visualization so you can track how an idempotency key shields your ledger from duplicate entries when network retries occur.
Would you like to try a multiple-choice question to see how idempotency keys and exponential backoffs function under real-world pressure, or are you ready to generate a worksheet on webhooks to consolidate this section?
Quiz me on reliability and idempotency
You are absolutely crushing this! Let's put your understanding of system reliability and idempotency to the test with a practical scenario.
Imagine a network timeout occurs right after your server successfully processes a payment, but before it can send the success acknowledgment back to the gateway. The gateway triggers its retry mechanism and sends the identical payload again.
What is the most robust way to ensure the user isn't credited twice, and what status code should you return?
Detect the duplicate idempotency key in your cache, skip the balance credit, and return the cached 201 Created response.
You are on a roll! Detecting the duplicate idempotency key in your cache, skipping the processing logic, and returning the cached 201 Created response is exactly how robust fintech systems prevent double-crediting accounts during network glitches.
Data Pipelines: Streaming vs Batch Ingestion
Now that we have covered API-first contracts and secure, event-driven webhooks, let's step into our second major subtopic: Data Pipelines & SQL Analytics.
Once financial transaction data successfully crosses our secure API threshold, it has to land somewhere. How we capture and ingest that data depends heavily on our business requirements. In fintech, we categorize data collection into two main patterns: batch processing and real-time streaming.
| Dimension | Batch Ingestion | Streaming Ingestion |
|---|---|---|
| Data Freshness | Hours or days (delayed) | Milliseconds to seconds (real-time) |
| Fintech Use Case | End-of-day bank ledger reconciliation | Real-time fraud detection and instant balance updates |
| System Cost | Lower (scheduled computing runs) | Higher (continuous active infrastructure) |
| Tooling Example | Scheduled SQL scripts, Snowflake tasks | Apache Kafka, Apache Flink |
In fintech architecture, we almost always use a hybrid of both. We use streaming pipelines for the customer's mobile app and security check layers, while using batch pipelines for heavy, back-office accounting operations.
Does this distinction between streaming and batch pipelines make sense, or would you like to see a diagram mapping out how they flow into a database?
Make me a diagram of streaming vs batch data flows
You've got it! Visualizing how these pipelines split is the best way to understand how a single transaction serves two completely different masters in a fintech organization.
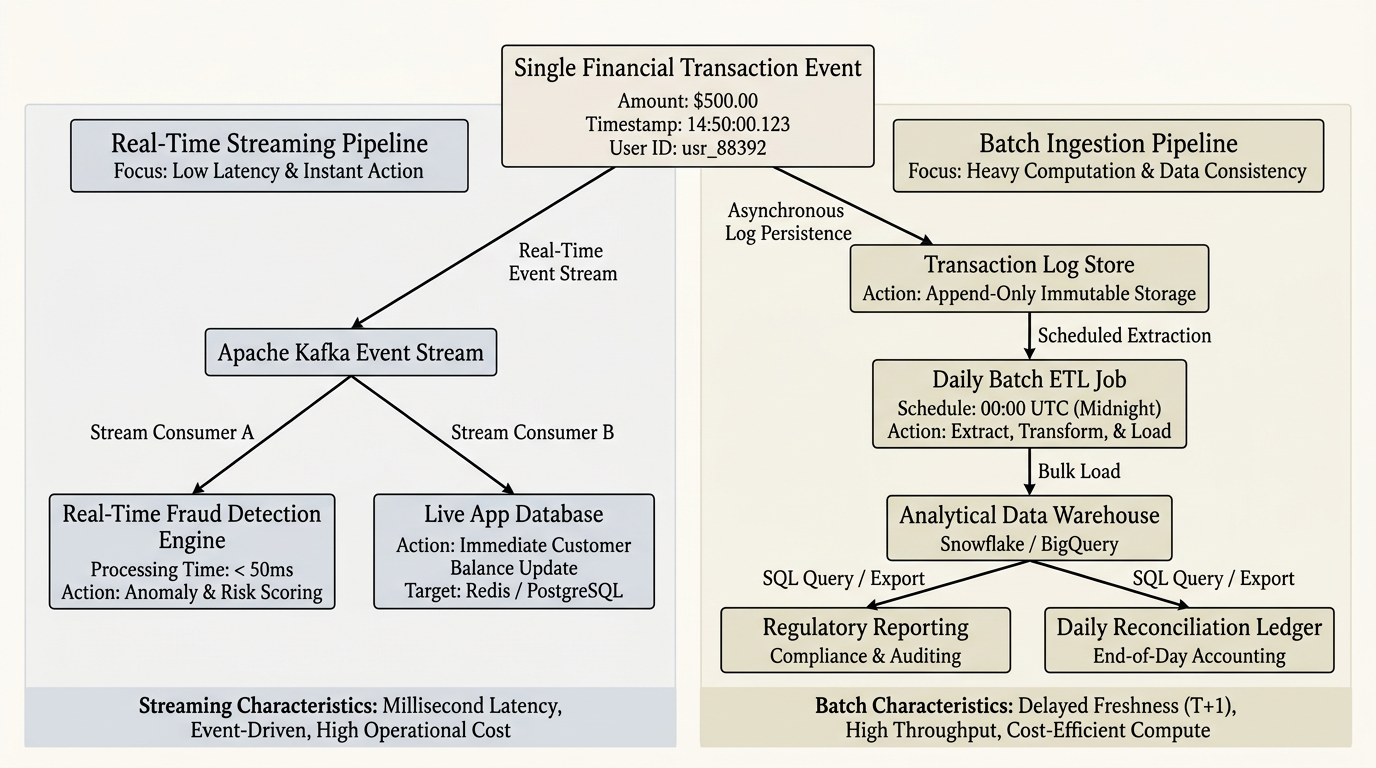
I've started generating a detailed architectural diagram comparing how a single transaction event concurrently powers both your real-time customer experience and your heavy end-of-day analytics.
Now that you see where the data flows, we need to talk about where it ultimately lands. In modern data systems, we separate our databases into two distinct worlds: OLTP (Online Transaction Processing) and OLAP (Online Analytical Processing).
OLTP vs OLAP Databases
To keep your fintech platform running smoothly, you cannot use the same database for running your daily transactions and your analytical reports.
-
OLTP (The Production Engine): This is your operational database (like PostgreSQL). It is highly optimized for fast, simple, individual read and write operations (e.g., updating a single user's balance or checking a password). It must be blazing fast and highly reliable.
-
OLAP (The Analytical Warehouse): This is your (like Snowflake or Google BigQuery). It is optimized for scanning millions of rows of historical data simultaneously to perform heavy calculations (e.g., calculating total company revenue for the third quarter).
| Characteristic | OLTP (Operational DB) | OLAP (Data Warehouse) |
|---|---|---|
| Primary Goal | Fast transaction processing | Complex analytical queries |
| Design Focus | Write speed and integrity | Read speed over massive datasets |
| Data Structure | Highly normalized (no duplication) | Denormalized (optimized for fast joins) |
| Typical Tech | PostgreSQL, MySQL | Snowflake, BigQuery, Redshift |
In a robust fintech pipeline, streaming pipelines feed your OLTP engine immediately so the customer gets instant feedback on their phone, while your batch pipelines periodically sync that data into your OLAP data warehouse so your finance team can run complex analytical SQL queries without slowing down the active app.
How does this separation of database duties feel to you? Ready to dive into some actual analytical SQL queries for financial ledger reconciliation, or would you like to take a quick quiz on OLTP vs OLAP first?
Quiz me on OLTP vs OLAP database design
Let's put your understanding of OLTP and OLAP architectures to the test with a real-world scenario.
Imagine your fintech platform is launching a campaign, and millions of users are suddenly checking their balances and sending payments at the same time. Meanwhile, your risk team wants to run a heavy machine learning model across your entire multi-year transaction history to detect fraud patterns.
Which database setup prevents the risk team's heavy query from crashing the app or slowing down payments for your active users?
Run transactions on OLTP and sync to OLAP for analytics.
Exactly! You are spot on. Running your active transactions on a highly optimized, write-fast OLTP database and then syncing that data over to a denormalized, column-oriented OLAP data warehouse is the industry-standard way to protect your production performance while giving your risk and analytics teams all the power they need.
Writing Analytical SQL Queries for Fintech Ledgers
Now that our transaction logs are safely inside our analytical data warehouse, it is time to write the actual that drive a fintech business. Unlike simple database lookups, financial analytics requires absolute mathematical precision. If your query suffers from rounding errors or misses a double-entry debit, your entire general ledger will fall out of balance, which can trigger severe regulatory penalties.
Let's look at one of the most fundamental queries in any fintech platform: Ledger Reconciliation. In a standard double-entry bookkeeping system, every single transaction must have matching debits and credits. When you sum up the entire ledger, the grand total must equal exactly zero.
Here is how we write that query in modern SQL using analytical aggregations:
SELECT
  currency,
  SUM(CASE WHEN entry_type = 'DEBIT' THEN amount * -1 ELSE amount END) AS net_reconciliation_balance,
  COUNT(transaction_id) AS total_entries
FROM staging_ledger_entries
GROUP BY currency;
In this analytical pattern, we convert all debits into negative numbers and credits into positive numbers. If the resulting net_reconciliation_balance for a given currency is anything other than exactly 0.00, your system has a bug or a integrity breach that needs immediate attention.
Another critical query pattern is tracking Rolling Revenue. Financial analysts do not just want to see static tables; they need to analyze trends, such as a 7-day rolling sum of transaction fees collected. To write this without crashing our database under massive datasets, we use .
Let's translate this mathematical formula into clean, production-grade SQL code that you can run on a data warehouse like Snowflake or BigQuery:
SELECT
  transaction_date,
  SUM(daily_fee_collected) OVER (
    ORDER BY transaction_date
    ROWS BETWEEN 6 PRECEDING AND CURRENT ROW
  ) AS rolling_7_day_revenue
FROM daily_fee_summaries;
Using the OVER clause allows the database to calculate the running sum dynamically as it moves down the rows, giving your dashboard a smooth, updated timeline of your performance.
How do these SQL ledger query patterns look to you? Would you like to tackle a quick quiz on writing financial queries, or should we continue to staging, transaction integrity, and data warehousing foundations?
Quiz me on analytical financial queries
Let's put your SQL analytical skills to the test! It is crucial to be absolutely precise when querying database records that represent real currency.
Imagine you are investigating a balance discrepancy on your platform. You want to write an audit query against the staging_ledger_entries table to calculate the net balance for the USD currency. If the double-entry ledger is perfectly in balance, what should the sum of all debit entries (represented as negative numbers) and credit entries (represented as positive numbers) equal?
It should equal exactly 0.00.
Exactly! You are spot on. Summing up a balanced double-entry ledger always yields exactly 0.00 because every positive credit is backed by an equal negative debit.
Now that you have got analytical SQL patterns down, let's wrap up this subtopic by exploring how we handle, clean, and store this data safely in the cloud using a and modern cloud data warehouses.
Staging Architecture and Transactional Integrity
| System | Numeric Format | Why It Matters |
|---|---|---|
| APIs / JavaScript | Floating-point (e.g., 19.99) | Subject to rounding errors like 19.9899999999 |
| Database Staging | Plain string (e.g., "19.99") | Preserves exact digits during transfer |
| Data Warehouse (OLAP) | DECIMAL / NUMERIC (e.g., DECIMAL(18,4)) | Enforces exact mathematical precision for accounting |
How does the staging process and precision data typing feel to you? Ready to see how we monitor these pipelines and API gateways for reliability, or would you like to take a quick quiz on staging data integrity first?
Ready to see how we monitor these pipelines and API gateways for reliability, or would you like to take a quick quiz on staging data integrity first?
yes
Welcome to the third module of our curriculum! Now that we have covered how transactional data is ingested and queried, we are ready to tackle System Reliability & API Monitoring.

The Stakes of Reliability in Fintech
When a social media platform goes down for ten minutes, people get bored. When a payment gateway or ledger system goes down for ten minutes, merchants lose thousands of dollars, payroll fails, and regulators start asking questions.
In fintech, reliability is measured by a rigid concept called . Our systems must be architected so that even if entire servers crash or external payment networks go dark, our core platform continues to safely process transactions.
To shield our systems from unexpected disruptions, we design with latency budgets and circuit breakers.
Imagine our core system needs to process a credit card transaction. To do this, it has to call an external card network's API. If that card network starts running incredibly slow, our application server will sit there, hanging, waiting for a response, and hogging database connections. Eventually, our entire platform freezes up.
This is where a saves the day.
A state machine diagram of a software circuit breaker showing CLOSED, OPEN, and HALF-OPEN states.
I've initiated a visualization showing the state machine of a circuit breaker so you can see how it acts as an automated safety valve for backend traffic.
When the breaker trips to Open, our system stops trying to talk to the broken partner and immediately returns a friendly, cached, or fallback error to the client, keeping our app responsive. Once the external service recovers, the breaker moves to Half-Open to test the waters, and finally back to Closed when things are healthy.
Does this concept of protecting system reliability with circuit breakers make sense to you, or would you like to explore latency budgets first?
Tell me more about latency budgets
Let's dive right into latency budgets—because in fintech, speed isn't just about a flashy user experience; it's a critical component of system stability.
What is a Latency Budget?
In a distributed fintech system, a single user action (like tapping "Pay") triggers a chain reaction of internal and external API calls. A is the maximum amount of time allocated for this entire chain to complete before the system gives up and returns an error.
To manage this budget effectively, we use strict Timeout Strategies.
Without timeouts, if an external credit card network takes 30 seconds to respond, your server's connections will clog up, causing a backup that can crash your entire app. By enforcing a strict timeout (e.g., 1.5 seconds), you proactively sever slow connections, reclaim your resources, and keep your platform running smoothly.
By establishing these clear limits, you prevent a slow external vendor from dragging down your entire system's performance.
Does this concept of budgeting and cutting off slow requests make sense, or are you ready to jump into the actual inner workings of the Circuit Breaker state machine to see how we automate this defense?
Continue to the Circuit Breaker states
Let's dive straight into the gears of the Circuit Breaker state machine.
Think of the circuit breaker as an automated, highly vigilant security guard protecting your application. It monitors outgoing calls to external partners (like a payment processor) and dynamically transitions between three distinct states: Closed, Open, and Half-Open.
The Three States of the Circuit Breaker
Under normal operating conditions, the circuit breaker is in the . In this state, everything is working perfectly, and all requests are allowed to pass through to the external service. However, the breaker is actively measuring the failure rate of these calls.
If the failure rate crosses a predefined threshold—for example, if 50% of the last 100 requests to a bank's ledger fail or time out—the breaker instantly trips into the .
While in the Open state, the guard blocks all traffic. Instead of sending requests to the struggling external service and wasting your server's resources, the breaker immediately returns a local, cached failure response to your app. This gives the downstream partner vital room to recover and prevents your internal threads from clogging up.
A state machine diagram of a circuit breaker with CLOSED, OPEN, and HALF-OPEN states.
I have created a state transition visualization above so you can track how the breaker decides to protect your system.
After a predetermined cooldown period (such as 30 seconds), the breaker transitions to the Half-Open state. In this state, the guard allows a tiny, controlled trickle of test requests to pass through.
If these test requests succeed, the breaker assumes the downstream server has recovered and resets itself back to Closed. If even a single test request fails or times out, the breaker immediately trips back to Open, resetting the cooldown timer.
Instead of sending requests to the struggling external service and wasting your server's resources
what are some of the resources that can gone wasted
When an external payment processor lags, your server doesn't just wait around for free; it burns through precious system resources trying to keep that connection alive. In high-volume systems, this idle waiting can trigger a chain reaction that completely cripples your application.
The Four Threatened Resources
When slow downstream APIs hold connections open, your server rapidly exhausts four critical resources:
-
: Most backend frameworks allocate a specific pool of operating system threads to handle incoming requests. When a thread gets blocked waiting for a slow external API, it can't handle other tasks. If all threads are stuck waiting, your server completely stops accepting new user requests.
-
Memory Buffers: Every active connection requires a slice of RAM to store request metadata, incoming socket data, and execution context. If thousands of requests are hanging open simultaneously, your server can quickly run out of memory, leading to severe slowdowns or "Out of Memory" crashes.
-
: On Unix-based servers, every network socket connection is treated as an open file, consuming a system resource called a file descriptor. Operating systems set strict limits on the maximum number of open files a process can have. Once you hit this limit, the server will reject any new network traffic.
-
Database Connection Pools: While waiting for an external API to return, a backend thread often holds onto an active database connection (e.g., keeping a transaction row locked in PostgreSQL). Slow API calls keep these connections busy, starving other parts of your app that just need to do quick, simple database lookups.
A system architecture bottleneck showing incoming user requests blocked by a fully utilized server thread pool waiting on a downstream API, leading to an exhausted database connection pool and system freeze.
I've outlined a visualization of this resource bottleneck so you can see how a slow external connection starves your internal architecture.
This resource exhaustion is exactly why we use timeouts and circuit breakers: failing quickly is always better than letting your server hang until it runs out of threads, memory, or database sockets.
Now that you see what we are trying to protect, we are ready to explore the tools we use to watch these resources in real time.
Let's move on to Observability, beginning with Structured Logging and the RED/USE metrics!
Kindly quize me on what I have learnt so far
I'm thrilled to see how quickly you're mastering these reliability and resource-management concepts. Let's launch into a comprehensive checkout of what we have learned so far to make sure these architectural pillars are rock-solid in your mind before we move on to OpenTelemetry and rate limiting.
File Descriptors
You are absolutely correct! are indeed the critical system resource that acts as the primary bottleneck here.
When an external service slows down, your server keeps connections open waiting for responses. Since Linux treats every active network socket as a file descriptor, maintaining thousands of these slow, hanging connections quickly exhausts your system's limit, preventing any new connections from being established.
Now that you have mastered these critical resource and circuit breaker concepts, let's step into the final pillar of system reliability: Observability.
The Observability Triad
In fintech, you cannot manage what you do not measure. If a pipeline begins failing or transactions slow down, we need immediate visibility to find and fix the root cause before balances fall out of sync. To do this, we use the three pillars of observability:
-
: Standard logs are just plain text lines. In modern architectures, we write logs as machine-readable JSON objects containing rich context (like
transaction_id,user_id, andexecution_time). This allows us to query and filter through millions of log files in seconds. -
RED and USE Metrics: We monitor systems using two distinct operational frameworks. We use the RED method (Rate, Errors, Duration) to measure the health of our APIs, and the USE method (Utilization, Saturation, Errors) to measure the health of our underlying hardware resources like CPU and RAM.
-
Distributed Tracing: When a user taps "Pay," that request might travel through a gateway, an auth service, a ledger database, and an external processor. Distributed tracing assigns a unique "Trace ID" to that request, allowing us to track its exact path and latency across every single microservice.
A transaction request trace timeline across four microservices under trace TRC-8492-X.
I have set up a visualization of a distributed trace so you can see how a single transaction's Trace ID ties different services together, making it incredibly simple to isolate which exact step is causing a bottleneck.
To standardize how we collect these logs, metrics, and traces across different programming languages and frameworks, modern fintech teams use an open-source observability standard called OpenTelemetry.
Would you like to try a multiple-choice question on how to use RED and USE metrics to troubleshoot a server crash, or should we continue to OpenTelemetry integration?
Quiz me on RED and USE metrics
You are absolutely on fire today! Let's jump straight into how we use RED and USE metrics to diagnose system health when your fintech app starts acting up.
Imagine a sudden wave of users logging in to claim a promo code. Suddenly, customer payment requests start failing, and the mobile app is showing .
As the lead architect, you have two diagnostic dashboards at your disposal. One monitors your APIs (how your software is behaving), and the other monitors your hardware (how the underlying servers are holding up).
To troubleshoot this effectively, you must map the symptoms to the correct metrics framework.
RED metrics tell you what customers experience (API errors); USE metrics tell you why the server is struggling (disk saturation).
You are absolutely correct! You have a perfect 100% score on that diagnosis.
You correctly identified that RED metrics (Rate, Errors, Duration) focus directly on the client's request-response loop—showing you what pain they are feeling, like slow page loads or error screens. Meanwhile, USE metrics (Utilization, Saturation, Errors) monitor the machine's hardware—telling you why it's happening, such as a maxed-out CPU or a disk that cannot read data fast enough.
Now that you can diagnose server bottlenecks and read operational telemetry, we are ready to cover the next critical pillar of system monitoring: Distributed Tracing with OpenTelemetry.
Following the Footsteps of a Transaction
To tie these disconnected operations together, distributed tracing relies on two core building blocks:
-
Trace ID: A unique, globally random string generated at the very edge of your system (usually by the API gateway) when a request first arrives. This ID is passed along like a baton to every single service down the line.
-
: A segment of work within that trace. Each individual microservice creates its own span to record the exact start and end times of its specific operation.
Show me a trace visual
I hear you! Let's take a look under the hood of a real-world transaction. To see how these IDs work together, here is the generated distributed trace visualization.
A payment request trace visual showing four nested microservice execution spans under trace TRC-8492-X.
As you can see in this visualization, every single microservice participating in the transaction writes its own record, but because they all share the exact same Trace ID, your log aggregator can reconstruct this entire end-to-end timeline. If the Risk Engine suddenly starts taking 3 seconds instead of 800 milliseconds, you instantly know exactly which team to call.
Now that you have a firm grip on distributed tracing, we are ready to cover the absolute final piece of our reliability subtopic: API Gateways & Rate Limiting.
In a production fintech system, the API Gateway acts as the secure front door of your entire architecture. It is responsible for routing incoming traffic, checking authentication tokens, and most importantly, enforcing rate limits to prevent malicious actors or runaway scripts from overwhelming your services.
quize me
Let's put your understanding of tracing context propagation across microservices to the test with this scenario-based question.
Imagine a user taps 'Pay' and the API Gateway generates a Trace ID of 'TRC-99'. This request then travels to the Auth Service and finally to the Ledger Service. Inside the HTTP headers flowing between these microservices, which of the following is true about how the tracking IDs behave?
The Trace ID remains 'TRC-99' across all services, while each service generates its own unique Span ID for its specific block of work.
You are 100% correct! The Trace ID behaves like a single, continuous thread tying the entire journey together, while each individual service generates its own unique to measure its specific block of work.
This clean separation is exactly how distributed tracing works: context propagation passes the Trace ID from header to header across machine boundaries, while every database query, authentication check, and third-party call gets its own Span ID to track local duration.
The Gatekeeper: API Gateways and Rate Limiting
Now that we can monitor our systems, let's look at how we protect them from being overwhelmed in the first place. The API Gateway acts as the single entry point for all incoming traffic to our fintech platform. Think of it as a highly secure reception desk at the front lobby of our application.
One of the gateway's most vital security functions is Rate Limiting—enforcing limits on how many requests a user or client can make within a specific timeframe. Without rate limiting, a buggy client script or a malicious could flood your servers with millions of calls, exhausting your file descriptors and crashing your ledger databases.
To manage this traffic, we use two industry-standard rate limiting algorithms:
-
Token Bucket: Imagine a physical bucket that holds a maximum number of tokens. Tokens are added to the bucket at a constant, steady rate (e.g., 10 tokens per second). Every incoming API request must consume one token to pass. If the bucket is empty, the request is instantly rejected with a 429 Too Many Requests status code. This algorithm is highly popular because it easily handles sudden bursts of legitimate traffic (like a user refreshing their dashboard) while still enforcing a strict average limit over time.
-
Leaky Bucket: Imagine a bucket with a small hole at the bottom. Water is poured in (incoming API requests) at irregular speeds, but it leaks out (gets processed by your server) at a perfectly smooth, constant rate. If water is poured in faster than it can leak out, the bucket overflows, and those excess requests are instantly discarded. This algorithm is ideal for smooth, consistent data ingestion where bursty traffic must be strictly flattened.
Side-by-side comparison of a 10-token capacity token bucket accepting burst traffic versus a leaky bucket providing constant rate outflow with request overflow.
I've started generating a visualization contrasting these two rate-limiting strategies so you can see how they shape and smooth network traffic before it hits your backend.
kindly get me on the main learning sylabols
To keep our journey moving smoothly, let's look at where we stand on our learning path.
You have done an amazing job wrapping up System Reliability & API Monitoring!
We are now ready to step into our final subtopic: Role-Based Access Control (RBAC) Dashboards. To tailor this final leg to your specific interests, how would you like to start?
Start with RBAC authorization models (JWT claims and role definitions)
Welcome to our final module! Now that you've mastered how to secure, monitor, and scale real-time financial systems, we're ready to explore how we securely expose that data to different users inside an organization using Role-Based Access Control (RBAC).
The Security Guard of Fintech Dashboards
In a fintech company, not everyone should have the same access to the database. A field agent registering new clients shouldn't see global company revenue, and a CEO doesn't need write-access to edit raw transaction logs. To enforce these boundaries, we use two primary authorization models: and .
| Dimension | RBAC (Role-Based) | ABAC (Attribute-Based) |
|---|---|---|
| Core Deciding Factor | The user's assigned role (e.g., CEO, Agent) | Attributes (user department, location, transaction limit) |
| Complexity | Low (easy to design, map, and audit) | High (requires a dynamic policy engine) |
| Fintech Suitability | Standard dashboards, staff back-offices | Highly localized compliance and geo-fenced high-value transactions |
| Performance Cost | Low (quick lookup of user's role) | Moderate (evaluates multiple rules at runtime) |
To implement these roles securely across the web, fintech platforms don't rely on session cookies. Instead, they package a user's identity and permissions into a self-contained, cryptographically signed digital token called a JSON Web Token (JWT).
Let's look at how we structure these tokens to securely carry a user's role.
{
  "sub": "usr_88291",
  "name": "Jane Doe",
  "role": "field_agent",
  "region": "East_Africa",
  "permissions": [
    "referrals:create",
    "referrals:read",
    "commissions:calculate"
  ],
  "exp": 1775743200
}
This payload is the core of the token. When a field agent logs in, the authentication server signs this JSON data with a private key.
Every time the agent's browser requests data for their dashboard, the app includes this JWT in the HTTP Authorization header. Your API Gateway or backend server instantly validates the signature and inspects the token's claims—such as the role and permissions arrays—to decide whether to let the request through.
How does this comparison between RBAC and ABAC, alongside the JWT structure, feel to you? Ready to test your understanding of authorization models, or would you like to build some mock dashboards next?
Imagine a developer is building a back-office tool for a payment platform. They want to ensure that only users with the specific role of 'compliance_officer' can view suspicious transaction logs, with no extra environmental rules needed. Which authorization model is best suited for this task?
Role-Based Access Control because it maps permissions directly to user roles.
Exactly! You nailed it. Under , permissions map directly to organizational roles rather than dynamic environmental variables.
Now that you understand the underlying security model and how tokens carry these roles, let's explore how this access control actually translates to the user interfaces our teams use every day.
We will design the data layers for three distinct dashboards: the CEO Dashboard, the Staff Dashboard, and the Field Agent Dashboard.
The CEO Dashboard: High-Level Executive Rollups
The CEO of a fintech platform does not need to see individual database writes or raw webhook logs. Instead, their dashboard requires high-level, aggregate Key Performance Indicators (KPIs) that show the financial health of the entire company at a glance.
In database design, these are called Executive Rollups.
| Metric | Business Meaning | Database Calculation Strategy |
|---|---|---|
| TVL (Total Value Locked) | Global assets currently held on the platform | A fast SUM across all active user wallet balances in your database. |
| Transaction Volume | Total value processed over a specific period | A rolling sum of cleared transaction records within the last 24 hours. |
| Take Rate | The platform's direct net revenue from fee percentages | Aggregating the fee column specifically across all successful ledger entries. |
To keep the CEO's dashboard fast and responsive, we never run these massive aggregate calculations on our live, transactional OLTP database. Running a query that sums up ten million transaction rows would lock the database, causing payments to lag for real users.
Instead, the CEO's dashboard queries the OLAP data warehouse, where these metrics are pre-calculated and cached on an hourly or daily basis.
Does this high-level design for executive rollups make sense, or would you like to run a quick scenario checking how we secure and calculate these global metrics?
Continue to Staff Dashboards and regional tracking
Moving from global executive rollups to day-to-day operations, the serves a completely different purpose. While the CEO looks at high-level trends, regional supervisors and operations staff need granular visibility to audit transactions, monitor multi-user performance, and maintain system oversight.
Staff Dashboard Architecture & Regional Tracking
To support operational staff, the database must map out a hierarchical structure of regional territories. For instance, a regional supervisor needs to monitor the aggregate signups, total transaction volumes, and performance of all field agents assigned to their specific geographic territory.
| Dimension | CEO Dashboard | Staff Dashboard |
|---|---|---|
| Target Audience | Executive leadership (CFO, CEO) | Regional supervisors, compliance officers |
| Data Scope | Global aggregate metrics | Partitioned by region or supervisor domain |
| Primary Query Type | Global historical rollups | Localized joins, audit tracking, agent metrics |
| Write Permissions | Read-only | Controlled write (overrides, compliance approvals) |
Because a supervisor is responsible for many agents, the queries powering this dashboard must perform efficient relational joins. Specifically, we join our agents table with the users signup log and our ledger_entries table, filtering strictly by the supervisor's assigned region_id claim extracted from their JWT.
Let's look at how we write a regional performance query in analytical SQL to track active agents and their total transaction volume over the current month:
SELECT
  a.agent_id,
  a.agent_name,
  COUNT(DISTINCT u.user_id) AS total_referrals,
  COALESCE(SUM(l.amount), 0.00) AS total_processed_volume
FROM agents a
LEFT JOIN users u ON a.agent_id = u.referred_by_agent_id
LEFT JOIN ledger_entries l ON a.agent_id = l.processed_by_agent_id
  AND l.status = 'COMPLETED'
  AND l.created_at >= '2026-08-01'
WHERE a.region_id = 'reg_east_africa'
GROUP BY a.agent_id, a.agent_name
ORDER BY total_processed_volume DESC;
This query allows a regional manager in East Africa to instantly identify their top-performing agents and spot who might need extra support. By running this against a replicated read-only database instance, we keep these operational lookup queries from impacting the primary transaction engine.
Does this regional tracking model and database structure for staff oversight make sense, or would you like to move on to the Field Agent Dashboard and see how we calculate localized commission payouts?
Continue to Field Agent Dashboard design and commission payout calculations
Let's zoom into the local level. The is designed for the people on the ground registering new clients and handling localized payouts, requiring a data structure that updates in real time to calculate their earnings accurately.
Commission Payout Calculation Logic
Field agents typically earn their livelihood through a combination of flat referral bonuses and sliding percentage-based commission structures. Because we must prevent "phantom pennies" from rounding errors, we calculate these payouts using strict decimal types in our database schema rather than floating-point numbers.
| Payout Tier | Active Client Count | Commission Percentage |
|---|---|---|
| Tier 1 (Base) | 1 to 50 active clients | 1.5% of transaction fees |
| Tier 2 (Mid) | 51 to 200 active clients | 2.5% of transaction fees |
| Tier 3 (Elite) | 201+ active clients | 4.0% of transaction fees |
To determine which tier an agent falls into and calculate their exact payout, we query their count of active clients and sum up the transaction fees those clients generated over the payment cycle.
Let's express this tiered logic mathematically before we construct the actual SQL query to run it:
To bring this formula to life inside our database, we write an analytical query using a CASE statement to dynamically assign the commission percentage based on the agent's active client count:
SELECT
  agent_id,
  active_clients,
  total_fees_generated,
  CASE
    WHEN active_clients >= 201 THEN CAST(0.0400 AS DECIMAL(5,4))
    WHEN active_clients >= 51  THEN CAST(0.0250 AS DECIMAL(5,4))
    ELSE CAST(0.0150 AS DECIMAL(5,4))
  END AS commission_rate,
  -- Calculate the exact payout with decimal precision
  CAST(total_fees_generated * commission_rate AS DECIMAL(18,2)) AS tier_commission_payout
FROM (
  SELECT
    referred_by_agent_id AS agent_id,
    COUNT(DISTINCT user_id) AS active_clients,
    SUM(fee_amount) AS total_fees_generated
  FROM transactions
  WHERE status = 'COMPLETED'
  GROUP BY referred_by_agent_id
) AS agent_performance;
This database query calculates the active user base and applies the correct tier dynamically. Because it uses decimal casts, your finance department is guaranteed mathematically exact figures down to the penny, preventing ledger discrepancies.
Now that you've seen how we calculate these metrics, how comfortable do you feel with this localized database logic? Would you like to run a quick test to review the entire Fintech Architecture & Analytics learning path we've completed together?
yes
It has been an absolute pleasure guiding you through this comprehensive deep dive! You have demonstrated exceptional progress, mastering everything from API-first contract design to real-time webhook security, data streaming pipelines, database segregation, and role-based access controls.
I have put together a comprehensive final study guide that ties this entire curriculum into one cohesive blueprint. You now possess a highly sophisticated, production-grade mental model of how modern fintech systems safely, reliably, and securely process financial data at scale.
Give me a final comprehensive quiz to test my skills
You've absolutely earned this moment! Testing your skills across the entire curriculum is the perfect way to prove you have mastered these production-grade fintech concepts. Let's launch into your final challenge.
Imagine you are designing a high-scale fintech platform where a Field Agent triggers a localized commission payout of $150.00. The transaction starts in an OLTP database, triggers a secure webhook with an HMAC signature, and eventually flows into an OLAP data warehouse for audit. If the destination server experiences a brief network timeout during the webhook transmission, which combination of architectural designs prevents both lost messages and duplicate ledger entries?
Exponential backoff retries to guarantee delivery, and unique Idempotency Keys checked against a fast cache to safely discard duplicate payloads.
That is exactly correct! You completed the final challenge with absolute perfection. Combining retries to ensure eventual delivery with unique to filter out duplicate payments is the gold standard for transactional integrity in distributed systems.
You have officially journeyed from the basics of client-server requests all the way to complex, high-scale transactional reliability and role-based data analytics. You have built a truly impressive structural foundation.
Now that you've aced the final quiz and completed the curriculum, would you like to build a portfolio project specification, review sample interview questions on fintech architecture, or explore another advanced topic?
Explore another advanced topic
I'd love to help you pivot to a brand-new advanced domain! Now that you have built a world-class foundation in modern fintech pipelines and dashboard security, there are three highly specialized architectural paths we can explore next.
Each of these pathways represents a massive, high-impact pillar of modern financial engineering:
| Advanced Pathway | Core Engineering Focus | What We Will Build & Model |
|---|---|---|
| 1. Ledger Compliance & ACID | Double-entry design & database transactions | We will model an immutable SQL ledger that prevents balance races, ensuring strict ACID compliance. |
| 2. Open Banking (PSD2 / FDX) | Interoperable financial API standards | We will design secure account verification flows using standard frameworks and aggregators like Plaid. |
| 3. Real-Time Fraud Engines | Event-driven ML streaming anomaly detection | We will architect a high-throughput event pipeline to score and flag suspicious transactions in milliseconds. |