
Oboe
No history yet

Fibonacci Tool in Futures

Here is a proposed learning path to master the Fibonacci tool in futures trading:

Your path
Drawing Retracements on Futures Charts
Fibonacci Extensions for Profit Targets
Trade Execution & Risk Management

You can adjust this path at any time to better match your goals. Before we begin, I would love to know: what is your current experience level with futures trading or using charting tools in general?

I trade futures regularly but want to learn how to use Fibonacci tools.

Since you already trade futures regularly, integrating the Fibonacci tool will help you identify precise, high-probability levels of support and resistance during market swings. Let's start with our first subtopic: understanding the core concepts of Fibonacci retracements and how they differ from extensions in active futures trading.
When a futures contract is in a strong trend, it rarely moves in a straight line. Instead, it moves in impulses followed by temporary pullbacks, which are also known as retracements. The Fibonacci retracement tool helps you measure these pullbacks to find potential entry zones. The core ratios used in this tool are derived from the famous discovered by a 13th-century mathematician.
By calculating percentages from these mathematical ratios, the charting tool plots horizontal lines across your chart. The most critical retracement levels you will watch are the 38.2%, 50%, and 61.8% levels. In an uptrend, these percentages show how much of the initial upward move has been given back. Price stalling and finding buyers at these levels often signals a great opportunity to go long. Conversely, in a downtrend, they act as resistance levels to time short entries. While the 50% level isn't a true Fibonacci ratio, it is a highly watched where market participants frequently look to buy the dip or sell the bounce.
It is vital to distinguish between two key tools on your charting platform:
  • Fibonacci Retracements: Used to measure the depth of pullbacks during a trend to plan your entry.
  • Fibonacci Extensions: Used to project future price targets beyond the previous trend high or low once the trend resumes, typically focusing on the 127.2% and 161.8% levels to plan profit exits.
In highly leveraged and fast-moving markets like crude oil, gold, or equity index futures, these mathematical zones become critical battlegrounds where algorithms, institutional order blocks, and retail traders all place orders simultaneously, creating explosive reactions. Let's see how well you've grasped the core difference between these two tools with a quick check.

If you are looking to enter a long position on an E-mini S&P 500 futures contract after a strong upward move begins to pull back, which tool and primary zones are you analyzing?

Fibonacci Retracements at the 38.2%, 50%, and 61.8% levels

Technical Analysis
LV 3
Skills
Spot on. You correctly identified that measuring pullbacks to locate entry zones during an uptrend requires Fibonacci retracement levels, specifically targeting the 38.2%, 50%, and 61.8% zones to buy the dip. Let's move on to our next subtopic.
Your path
Fibonacci Extensions for Profit Targets
Trade Execution & Risk Management
Now that we are shifting our focus to drawing retracements on active futures charts, your accuracy depends entirely on identifying the correct anchors. To do this, you must first master how to spot major and minor on your price action charts. A swing high is a peak characterized by a high candlestick flanked by at least two lower highs on both its left and right sides. Conversely, a swing low is a trough consisting of a low candlestick flanked by at least two higher lows. In highly liquid, volatile futures contracts like E-mini index futures or crude oil, distinguishing major structural swings from minor intraday noise is what prevents you from drawing invalid levels.
When drawing the tool, your execution direction must match the prevailing trend. You must always draw from left to right on your charting platform. For an uptrend, click on the structural and drag the cursor up and to the right to lock onto the swing high. This accurately projects the retracement percentages downward, plotting your potential support zones below the current price. If you are analyzing a downtrend, you do the exact opposite: click on the swing high and drag your cursor down and to the right to lock onto the swing low, projecting your resistance zones upward.

To make this process clear, let's look at a visual representation of how to anchor your tool correctly in both market directions.
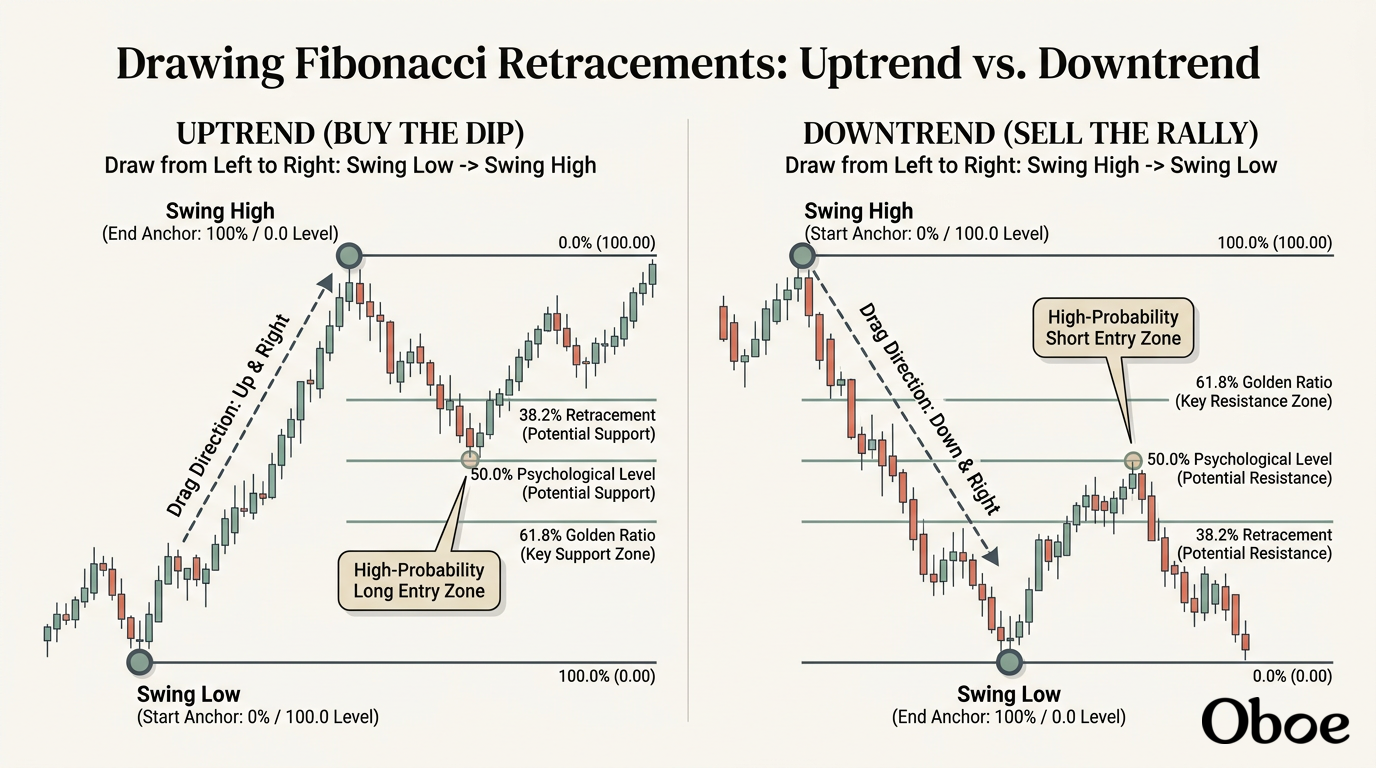
Drawing Fibonacci Retracements: Uptrend vs. DowntrendDiagram
I have initiated the generation of a diagram that walks you through these precise anchor steps visually. While that is being built, let's explore how we can apply this directly to a charting scenario. Imagine you are tracking a strong upward impulse on the Micro E-mini Nasdaq-100 futures contract. If you wanted to draw the retracement levels, which point would be your first click on the chart and which would be your second?

First click on the swing low, second on the swing high

Perfect execution. By starting at the swing low and dragging up to the swing high, you establish the baseline trend of the Nasdaq-100. This ensures that the horizontal retracement lines correctly appear below the current price as support, giving you precise, mathematically grounded coordinates to look for buyers. But as any active futures trader knows, a single chart can lie to you if you are not tracking the broader market context. This brings us directly to , which is the secret to finding the highest-probability trading zones.
When analyzing a liquid contract like Micro E-mini Nasdaq futures, you want to start on a higher timeframe, such as a daily or 4-hour chart, to draw your major Fibonacci retracements. If a major daily swing shows a deep pullback holding beautifully at a like the 61.8% level, that level becomes a major area of interest. Once you establish that higher-timeframe bias, you drop down to an execution chart, like a 5-minute or 15-minute chart. If a minor intraday retracement on the 5-minute chart aligns perfectly with that daily 61.8% level, you have found a high-probability entry zone where both swing traders and scalpers are looking to buy.
However, in highly leveraged and fast-moving futures markets, you will often see price temporarily pierce right through your drawn Fibonacci levels before reversing. These are known as . Because the futures market is highly volatile, market makers and institutional algorithms frequently push prices just past obvious support levels to trigger stop-loss orders and capture liquidity before sending the price back in the trending direction. To avoid getting trapped in these volatile fakeouts, you should never place limit orders blindly at a Fibonacci level. Instead, wait for price action confirmation—such as a bullish hammer candle or a sudden spike in volume—to prove that the level is actively holding before you execute your trade.
To help you master this critical step, let's look at how multi-timeframe analysis and false breaks work in a practical trading scenario. Imagine you see the daily chart of the E-mini S&P 500 futures contract pulling back to its 50% Fibonacci level, which aligns perfectly with a previous historical resistance line. When you drop down to your 5-minute execution chart, you notice the price quickly spikes 3 points below this exact level, but then immediately closes back above it with a massive surge in volume. What does this specific intraday price action suggest is happening at that Fibonacci level?

What does this sudden spike below the daily Fibonacci level followed by a high-volume recovery on the 5-minute chart indicate?

An institutional false break designed to hunt stops before reversing upward

Market Structure Analysis
LV 1
Price Action Trading
LV 1
Skills
Your analysis of that market trap is entirely correct. Spotting that swift dip below the daily support followed by a quick, high-volume recovery on your 5-minute chart shows you can identify a classic in real time. Institutional algorithms regularly drive prices past highly visible Fibonacci levels to absorb liquidity from retail stops before reversing the price. By waiting for that high-volume candlestick confirmation rather than placing blind limit orders, you protect your capital and trade alongside institutional flow.
Now that you have mastered drawing retracements to find high-probability entry points, we need to address the second half of the trading equation: planning your exit. This is where the three-point Fibonacci Extension tool becomes invaluable for projecting upside targets once a trend resumes. While retracements require only two anchor points (Swing Low to Swing High), extensions require a structure consisting of Point A, Point B, and Point C.
To set up this tool on your charting platform, you will follow the natural flow of the market's A-B-C wave pattern:
  • Point A (First Click): The structural swing low where the trend impulse originally began.
  • Point B (Second Click): The structural swing high where the initial move stalled.
  • Point C (Third Click): The established retracement low where buyers stepped back in to end the pullback.
Once you lock in Point C, your charting platform projects horizontal projection lines above the swing high. The primary mathematical extensions used as profit targets in active futures contracts are the 127.2%, 138.2%, and the highly reactive 161.8% levels. These lines represent key zones where buying momentum is statistically likely to exhaust as profit-taking orders hit the order book.
Because futures contracts are highly leveraged, executing a is often the most professional way to lock in gains. Instead of trying to hold your entire position for a home-run move at the 161.8% level, you can scale out. For example, if you are long multiple Micro crude oil or equity index contracts, you might close half of your position at the conservative 127.2% level to lock in green, trail your stop-loss upward to protect your remaining contracts, and leave a runner to target the 161.8% extension. This disciplined approach removes emotion from your trading and ensures you do not let a winning trade turn into a loss.
Let's put this into a concrete charting perspective to make sure you can apply it. Suppose you are long a gold futures contract. You anchored your tool at Point A ($2,000 swing low), Point B ($2,100 swing high), and Point C ($2,050 retracement low). Price is currently rallying back up and has just broken above the prior peak of $2,100. Where would you place your first and second profit-taking limit orders using key Fibonacci extensions?

Generate a study guide on Fibonacci extensions

I have initiated the creation of a comprehensive study guide focused entirely on mastering Fibonacci extensions in futures trading.

Fibonacci Extension Profit TargetsStudy Guide
This study guide will serve as a structured reference sheet for your trading desk as we move into trade execution. While the guide is compiling, let's look back at our active gold futures scenario. With your anchors set at Point A ($2,000), Point B ($2,100), and Point C ($2,050), the price has just broken above the prior peak of $2,100, indicating a strong trend continuation.
Using our core extensions to calculate your upside targets from the swing size of $100 ($2,100 - $2,000) projected from the retracement low of $2,050, the math reveals precise coordinates. Your conservative target at the plots at $2,177.20, while your high-conviction target at the lands at $2,211.80. In an active market, these are the exact levels where buy limits are filled and institutional supply hits the order book.
How would you divide your trade sizes between the 127.2% ($2,177.20) and 161.8% ($2,211.80) levels to lock in green while keeping a runner for a home-run move?

Continue to Trade Execution & Risk Management

We are now moving into trade execution and risk management, which is the most critical phase of futures trading. Knowing where to enter and exit is useless if you do not know how to protect your capital and structure your risk. Because futures contracts utilize high leverage, a disciplined approach here is what separates professional traders from those who struggle. Let's begin with the concept of technical , which is how you dramatically increase the win rate of your Fibonacci setups.
In active futures trading, you should never rely on a Fibonacci level in isolation. Instead, look for confluence by aligning your Fibonacci retracement lines with other powerful charting tools. The most effective combinations include:
  • Moving Averages: Watch for key levels like the 50-period or 200-period moving average to overlap with your retracement zone.
  • VWAP (Volume Weighted Average Price): In intraday trading, the acts as the ultimate benchmark of fair value. A pullback that tests both the VWAP and a 50% or 61.8% Fib level is a highly prized setup.
  • Volume Spikes: When price retraces to a key level, look for a sudden drop in selling volume as it approaches the line, followed by a major spike in buying volume, confirming that institutional players are defending the zone.
Once you identify a confluence zone and receive price action confirmation, your next step is to plan a precise stop-loss. In futures, placing your stop too tight leads to getting caught in stop hunts, while placing it too wide destroys your risk-to-reward ratio. The most professional method is to place your stop-loss just beyond the structural . If you enter a long position at the 61.8% retracement, your stop-loss should typically be placed just below the 78.6% level or, even safer, just below the original Point A swing low anchor. If the price breaks below that anchor point, the entire trend structure is invalidated, and you must exit the trade immediately.
To tie this all together, you must calculate your position sizing based on your stop-loss distance. Rather than trading a fixed number of contracts on every setup, professional traders calculate their size so that they only risk a specific, small percentage of their account balance (typically 1% to 2%) per trade. If your stop-loss on a Micro S&P 500 contract needs to be 10 points wide based on the Fibonacci structure, you must scale your contract size down so that those 10 points represent no more than your maximum allowed risk. This ensures that even a string of consecutive losses will not damage your trading capital. Let's test your ability to structure a trade using these risk parameters.

Suppose you enter a long E-mini Dow futures trade at a 61.8% Fibonacci confluence zone with a structural stop-loss placed just below the swing low anchor. If your stop-loss is 50 points away and you want to risk a maximum of $500 on the trade, how should you manage your position sizing and stop-loss placement? (Note: E-mini Dow futures have a tick value of $5 per point).

Trade 2 contracts and keep the stop-loss at the swing low anchor, risking $500.

Position Sizing
LV 1
Risk Management
LV 1
Skills
Your position sizing math is absolutely flawless. Trading exactly 2 contracts on the E-mini Dow allows you to risk exactly $500 with a 50-point stop-loss. Since each point on an E-mini Dow contract is worth $5, a 50-point move equals $250 of risk per contract. By executing exactly 2 contracts, you keep your total risk perfectly aligned with your mathematical threshold while keeping your stop-loss safely secured at the of the swing low anchor.
Now that you have mastered the mechanical risk calculations, we must address the real-world operational challenges of fast-moving futures markets. In highly liquid contracts like equity indices or crude oil, price action can move with extreme velocity during high-impact . During these times, executing manual trades can lead to devastating results because of latency and slippage.
To insulate your trading account from these volatile slips, professional traders always use pre-configured, automated bracket orders. A bracket order instantly attaches a profit target limit order and a protective stop-loss market order the millisecond your entry limit order is filled at the Fibonacci confluence zone. This automated structure ensures that your risk is capped even if your charting platform freezes or the market experiences a sudden flash crash. Furthermore, it completely removes the human emotion of hesitation, forcing you to accept your pre-calculated risk parameters on every single trade.
Let's summarize your complete technical workflow to solidify this powerful system. First, you identify the dominant market direction on a higher daily timeframe. Next, you anchor your Fibonacci retracement tool from left to right, matching the trend's swing points, to identify potential support or resistance. You then look for confluence with tools like VWAP, wait for clear price action candle confirmation, calculate your contract size using a strict risk model, and immediately deploy automated bracket orders to protect your capital. Once the trend resumes, you apply the three-point Fibonacci extension tool to project structured targets where you can scale out and capture profit.

You have done an outstanding job mastering this entire technical sequence from drawing to trade management. To make sure you have a permanent reference sheet directly on your desktop, would you like me to compile a comprehensive trading worksheet or a structured reference guide of this complete trading workflow?