
about databases then data warehouses, lakes and lakehouses. provide good examples for relational meaning
Welcome! I'm excited to help you unpack the differences between databases, warehouses, lakes, and lakehouses. Before we dive into the definitions and map out our learning path, I'd love to learn a little more about what brings you here.
What is your main goal for learning about these data architectures (for example, are you preparing for a job interview, studying system design, or just curious), and how comfortable do you currently feel with SQL or basic database concepts?
Just learning for fun/curiosity, absolute beginner to SQL
I love that you're exploring this out of pure curiosity—it is the absolute best way to learn! Since you're completely new to this world, we will start from the ground up, using clear analogies to make these big technical concepts feel simple and intuitive.

The Bedrock: What is a Relational Database?
To make this concrete, let's look at a visual representation of how tables link together inside a database using an e-commerce store as our example.
A database schema showing a relational link between Customers and Orders tables.
See how the two tables link together? By referencing the Customer ID in the Orders table, the database can easily connect who bought what without needing to repeat the customer's name and email on every single order. This is exactly what makes a database "relational."
Before we look at the software engines that power these databases, let's make sure this structure clicks.
Why don't we just put all data into one giant table?
That is the million-dollar question, and asking it shows you are already thinking like a database architect!
On the surface, putting everything into one massive spreadsheet seems like the easiest option. But as a business grows, a single-table approach quickly turns into a operational nightmare due to three massive problems:
-
& Waste: If a customer named "Sarah Connor" orders 50 times, you have to type her name, email, and shipping address 50 separate times. This wastes massive amounts of digital storage.
-
: Imagine Sarah moves to a new house. If you want to update her shipping address, you have to find and update all 50 of those rows. If your system misses even one row, your data is now corrupted and inconsistent.
-
Performance Penalties: To find a single order in a giant table containing millions of rows of bloated, repetitive text, the computer has to sift through massive amounts of unnecessary data, grinding your application to a painful halt.
To solve this, we use a process called normalization, which is just a fancy way of saying "breaking one big messy table into smaller, focused tables and linking them back together."
Let's take a look at a visualization to see how normalization completely changes how we organize this information.
Side-by-side comparison showing an unnormalized table with repeated customer data alongside a normalized database split into Customers and Orders tables.
I have created a visualization above to show how normalization neatly untangles that single-table mess.
By keeping Customers and Orders separate and using that shared "Customer ID" to link them, we only ever write Sarah's address once. If she moves, we update it in exactly one spot in the Customers table, and every order instantly references the correct new address!
Does this difference between a single giant table and normalized relational tables make sense?
Continue to operational vs analytical queries
You got it! Now that we understand how relational databases keep data neat and tidy, we need to talk about how we query that data.
In the data world, there is a massive divide between two different styles of questions we ask our systems: (Online Transactional Processing) and (Online Analytical Processing).
Think of it as the difference between a busy cashier at a grocery store checkout lane and the store's regional manager planning next year's inventory strategy.
The Checkout Lane vs. The Boardroom
Let's compare these two query patterns side-by-side to see how their technical demands differ so wildly.
| Feature | Operational (OLTP) | Analytical (OLAP) |
|---|---|---|
| Goal | Run day-to-day business operations | Find trends and make decisions |
| Query Type | Simple, highly targeted lookups | Complex calculations and scans |
| Data Volume | Tiny (one customer record) | Massive (years of history) |
| Speed | Sub-second (milliseconds) | Seconds to minutes |
| Data State | Lives in the active database | Aggregated in a warehouse |
Imagine Sarah is checking out at our e-commerce store.
An operational query (OLTP) is running behind the scenes. It says: "Find Sarah's customer ID and insert a new order record for $35." It is lightning-fast, touches exactly one or two rows, and needs to happen instantly so Sarah doesn't get frustrated.
Now, imagine the Vice President of Marketing wants to know: "What was our average order value for all customers named Sarah across the entire country over the last five years?"
That is an analytical query (OLAP). The computer can't just look up one row. It has to scan through millions of historical orders, calculate mathematical averages, and spit out an answer. If we tried to run this massive analytical search on the exact same database Sarah is trying to buy her shirt on, the whole system would freeze up, and Sarah wouldn't be able to checkout!
This performance bottleneck is the entire reason we don't use regular operational databases for heavy data analysis, and it's what led to the invention of the data warehouse.
Does this difference between quick operational updates and heavy analytical scans make sense?
Can you give me a diagram of how OLTP and OLAP systems interact?
I would love to show you how these two systems interact! It is one of the most elegant designs in modern software engineering.
To keep Sarah's checkout process lightning-fast, we keep the heavy analytical questions completely away from her shopping cart. Instead, we use a bridge process to continuously copy and prepare data from the transactional system to the analytical system.
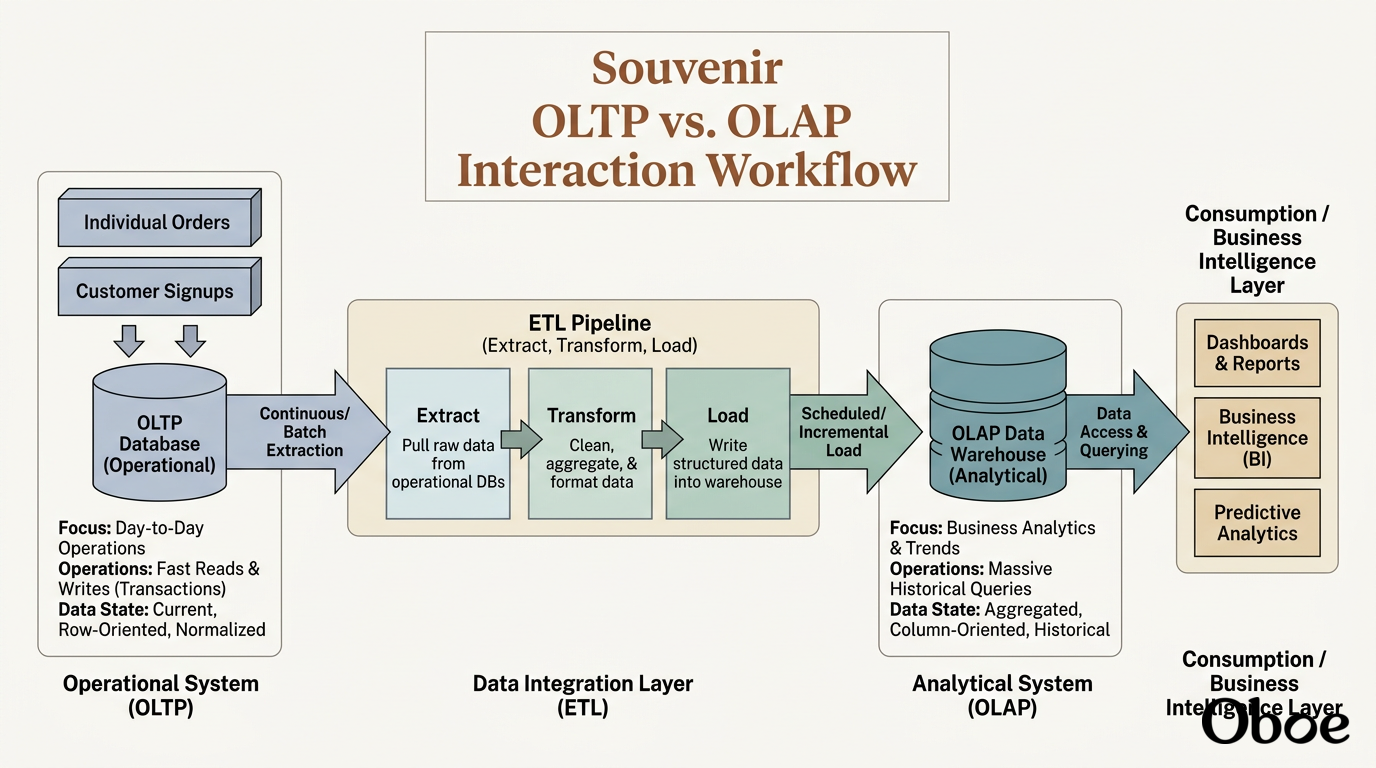
I've kicked off a diagram to show you exactly how this data pipeline flows.
As you'll see in the diagram once it generates, the magic happens in that middle step. We take the raw, relational transactional data, run it through a process to clean and organize it, and load it into a dedicated data warehouse. This keeps our operational database fast and responsive for customers, while giving business analysts a powerful, separate playground to run heavy queries without slowing anyone down.
Now that we've covered relational databases and how queries are split, we're ready to explore the dedicated home for those heavy analytical scans: the Data Warehouse.
Are you ready to see how a data warehouse structure differs from a standard database?
Continue to data warehouses and business analytics
Let's step into the world of Data Warehouses to see how they help businesses make big strategic decisions.
The Central Library of Business Facts
But how does raw data from all those different systems actually get into the warehouse in a usable format? It has to travel through a processing pipeline known as ETL.
Continue to the ETL process and Schema-on-write
The ETL Pipeline Explained
- Extract: First, we pull raw data out of all our different operational systems. We grab transaction logs from the website's database, customer feedback from support ticket software, and marketing metrics from social media ad portals.
- Transform: This is where we clean up the mess. Different databases might record the same thing differently. For example, the website database might write a date as
2026-08-11, while the marketing database writes it asAugust 11, 2026. The transform step standardizes dates, cleans up typos, removes duplicate records, and calculates totals. - Load: Finally, we write this clean, standardized data directly into the data warehouse where it is ready to be analyzed.
By enforcing schema-on-write, we guarantee that the warehouse remains an immaculate, trusted source of truth for business intelligence.
Now that you know how data is cleaned and loaded via ETL, would you like to see some concrete, real-world platforms where companies run these warehouses, or do you want to test your understanding of the ETL pipeline first?
Continue to Snowflake, Redshift, and BigQuery examples
Let's explore the powerful cloud engines that companies use to host and query these massive collections of organized data.
The Heavyweights of Cloud Data Warehousing
- Snowflake: Known for being incredibly user-friendly because it completely separates computing power from storage. This means a company can store petabytes of data cheaply, and only pay for heavy computing power during the exact minutes they are running complex reports.
- Amazon Redshift: Amazon's flagship warehouse, which is deeply integrated with the rest of the AWS cloud ecosystem. It uses to split a single giant query across a cluster of multiple computers, working together to deliver answers in seconds.
- Google BigQuery: Google's serverless offering, meaning there are absolutely no computers or infrastructure to set up or manage. You simply load your tables, write your query, and let Google's massive global network handle the rest in the background.
All three of these platforms are designed to handle highly structured, cleaned data that has gone through our ETL pipeline.
Now that we have wrapped up data warehouses, we are ready to venture into the wild west of data architectures: the Data Lake, where we don't clean anything up front at all!
Shall we continue on to see how data lakes handle unstructured data?